Bitcoin & Altcoins: Chart Signals Potential Market Bottom

The cryptocurrency market, after enduring weeks of considerable volatility and a noticeable downtrend, is now exhibiting crucial signs of stabilization, leading many analysts to suggest that a potential market bottom may be imminent. Bitcoin, the market's bellwether, has found a steady footing around the $90,000 mark, a price level it has consistently defended despite recent selling pressure. Concurrently, most major altcoins have demonstrated surprising resilience, with notable exceptions such as ASTER which has experienced a significant pump. This emerging stability, combined with a discernible shift in market sentiment from bearish apprehension to cautious optimism, paints a compelling picture for the near future of digital assets.
Key Points
- Bitcoin has stabilized around the $90,000 level, demonstrating robust defense against selling pressure.
- Major altcoins, including Ethereum and Solana, are holding key support levels, indicating widespread market resilience.
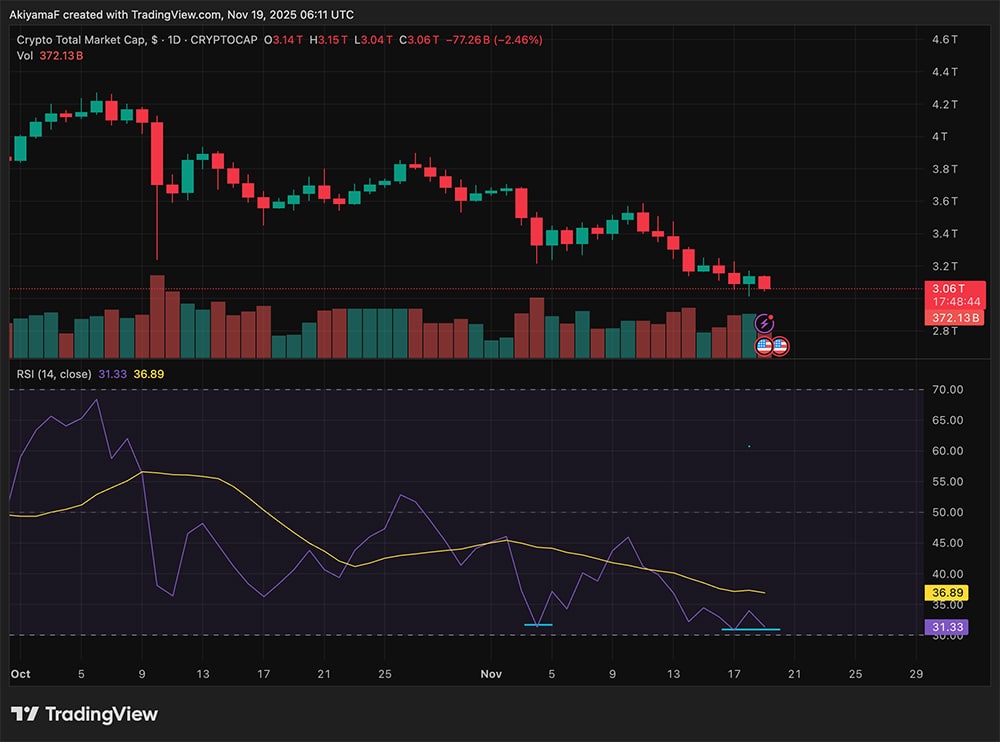
- Technical indicators such as the Relative Strength Index (RSI) dipping into oversold territory and the historical context of 'death crosses' suggest a potential market reversal.
- Over $1.1 billion in leveraged positions were cleared, a significant deleveraging event often preceding market upturns.
- Historical data for November consistently shows strong average gains for Bitcoin, adding a seasonal bullish bias.
- Evidence of "big-wallet" activity absorbing supply during market squeezes points to strategic accumulation by large players.
- The confluence of post-halving scarcity and constructive market behavior reinforces the thesis that a market bottom is either in place or extremely close.
Crypto Price Chart: Technical Signals Hinting at a Bottom
A meticulous examination of the current cryptocurrency price chart reveals several technical signals that strongly advocate for a market bottom. Bitcoin's repeated defense of the $90,000 zone is particularly noteworthy, serving as a critical psychological and technical support level. Despite a significant spike in selling volume witnessed last week, the absence of a deeper breakdown below this threshold suggests that long-term buyers have been quietly absorbing the selling pressure, preventing a more severe downturn.
Bitcoin's Resilient Defense and Altcoin Performance
This resilient behavior extends beyond Bitcoin. Major altcoins, especially market leaders like Ethereum and Solana, have commendably held their key weekly support levels after a period of significant leverage washout. This widespread stability among leading digital assets, rather than isolated strength, provides a more compelling argument for a broader market bottom. Furthermore, specific altcoins, such as ASTER, have even managed to defy the broader trend, posting impressive gains of approximately 20% over the past seven days, indicating pockets of strong demand and investor confidence.
Decoding Technical Indicators: RSI and the 'Death Cross'
Further bolstering the bottom-watch thesis are several key technical indicators. The Relative Strength Index (RSI), a momentum oscillator, has dipped into oversold territory across multiple timeframes. Historically, such RSI readings often coincide with mid-cycle resets and signify attractive entry points for long-term investors. Paradoxically, the recent 'death cross' observed on the crypto price chart – where a shorter-term moving average crosses below a longer-term moving average – may be less bearish than its ominous name suggests. Precedent from 2023 and 2024 shows similar crosses occurring just before significant 20–30% price rebounds. If historical patterns serve as a reliable guide, a bounce towards the $95,000–$98,000 range for Bitcoin appears increasingly realistic in the near term.
The Impact of Deleveraging on Market Dynamics
A crucial factor contributing to the current market stabilization is the extensive deleveraging that has occurred. Recent market movements successfully cleared more than $1.1 billion in leveraged positions, effectively flushing out excessive froth from the derivatives market. This deleveraging process is a vital cleansing mechanism. Historically, the Bitcoin price frequently establishes a bottom and begins an upward trajectory after such significant liquidity flushes, with altcoins typically following suit once funding rates normalize. This clearing of speculative positions creates a healthier, more sustainable market environment, paving the way for organic growth.
Historical Context: November's Influence on Bitcoin and Altcoin Prices
Beyond immediate technical signals, historical patterns for the month of November provide an additional layer of optimism for cryptocurrency investors. A comprehensive review of Bitcoin's performance across all Novembers since its inception reveals a surprisingly strong track record. On average, the Bitcoin price has historically gained over 40% during this month.
Analyzing Past November Performance
November has often served as a catalyst for notable market events. This includes the aftermath of the 2012 halving, the activation of Taproot in 2021, and various macro-driven rallies that have historically propelled prices upward. While exceptions exist, such as the infamous FTX collapse in November 2022, these instances were typically tied to extraordinary, idiosyncratic events rather than representative of typical seasonal market behavior. This year, despite leverage-driven volatility dominating headlines, including a more than $280 million flush of both long and short positions on November 11th and an earlier flash crash on October 10th, the underlying resilience remains evident.
(A chart from Coinglass illustrating Bitcoin's monthly returns consistently highlights November as a historically strong month for price appreciation, reinforcing the seasonal bullish sentiment.)
Institutional Maneuvers and Post-Halving Scarcity
These volatile market maneuvers also point towards strategic activity by large institutional players. Evidence of "big-wallet" activity suggests that these entities actively absorbed supply even as smaller positions were forced out of the market during these squeezes. Such historical market squeezes, notably seen in 2017 and 2021, often preceded massive price reversals. The current crypto price chart bears an eerie resemblance to these past events, suggesting a similar outcome could be on the horizon.
(An analysis shared on X (formerly Twitter) further details how these large player movements have historically correlated with significant market turning points, adding weight to the current bottoming narrative.)
Furthermore, the fundamental economics of Bitcoin, irrespective of macro correlations, continue to lean bullish due to post-halving scarcity. The halving event significantly reduces the supply of new Bitcoin entering the market, naturally tightening supply over time. With no structural break evident on the crypto price chart, and both Bitcoin and altcoins exhibiting increasingly constructive behavior, the market sentiment strongly leans towards a bottom being in, or at least being extremely close. The next decisive break above the $95,000 threshold for Bitcoin will serve as a critical confirmation signal for the commencement of the next significant upside turn. For now, market participants keenly observe, awaiting this definitive move.