
Year-End Economic & Market Outlook: Insights for 2026


As the year draws to a close, this assessment provides a comprehensive overview of the prevailing economic and market landscapes. While refraining from definitive forecasts—given our data-driven approach and the inherently dynamic nature of economic indicators—we aim to contextualize the current environment by examining historical precedents. This analysis seeks to equip readers with a foundational understanding for navigating the potentially eventful 12-15 months ahead.
Government Spending: Examining Fiscal Realities
A perennial topic of discussion, government spending often becomes a focal point of political discourse. Acknowledging the entrenched nature of current fiscal commitments, largely stemming from significant legislative approvals over the past decade, it becomes crucial to disentangle facts from sensationalism. The ongoing fiscal debates, often centered on relatively minor budgetary components, unfortunately overshadow the broader systemic challenges. A detailed examination of budget allocations reveals the true distribution of national expenditures.
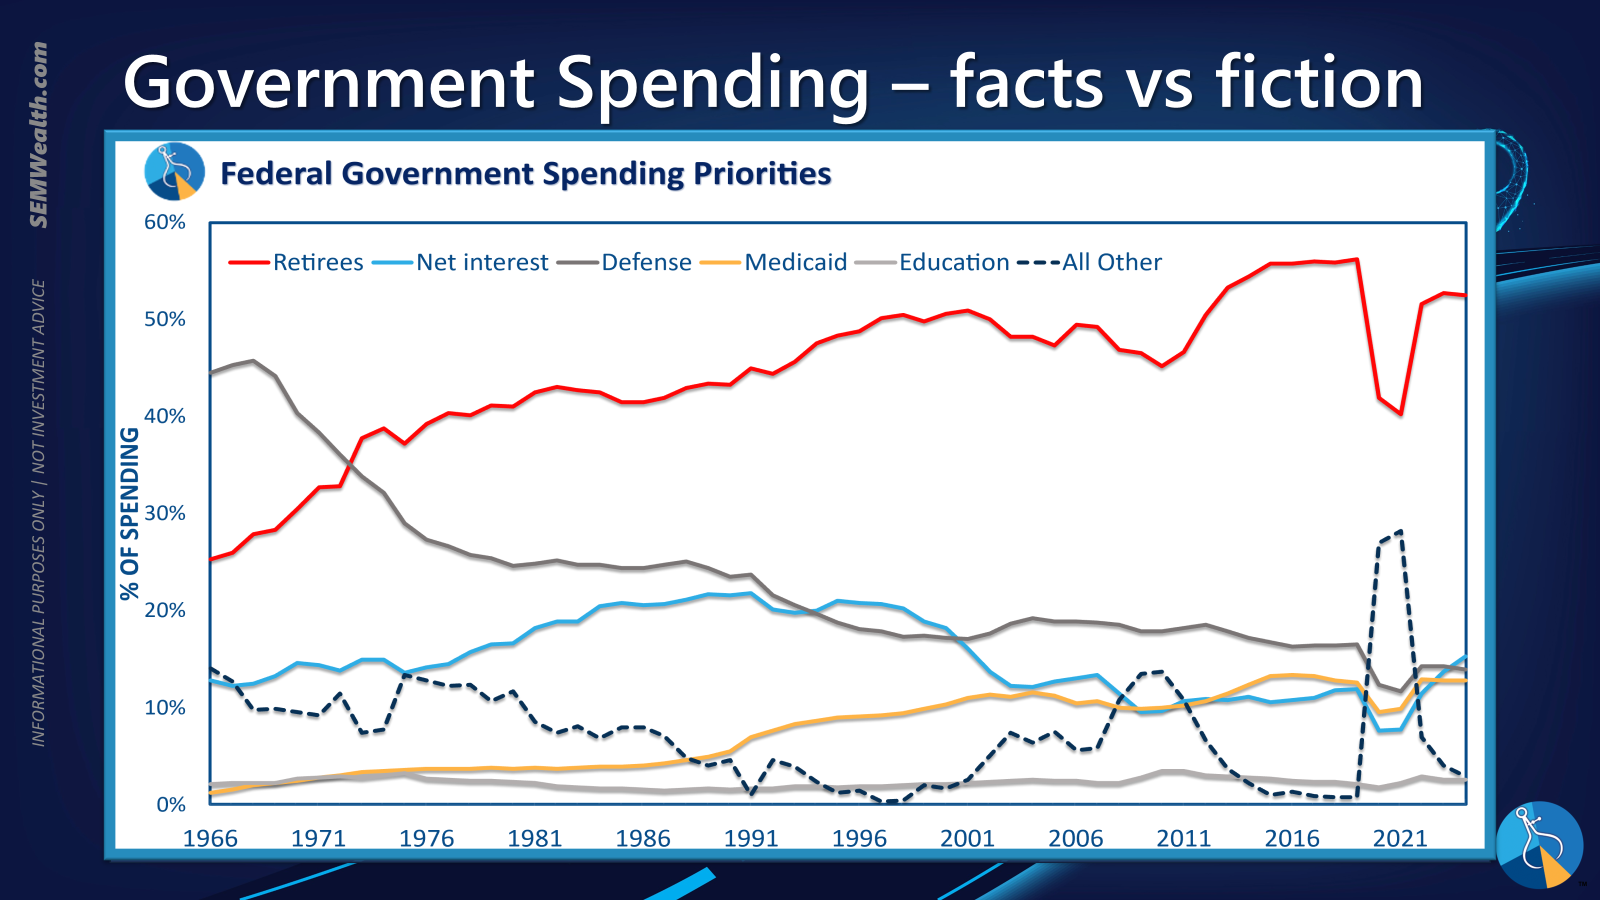
Our analysis indicates that a substantial portion of the national budget is directed towards a few key areas. When categorized for clarity, it becomes apparent that over half of total government spending is allocated to retirees. This demographic trend, alongside other major budgetary items, contributes significantly to the national deficit. While political attention frequently fixates on smaller controversies, the underlying drivers of the expanding deficit, particularly entitlements for an aging population, warrant more focused and sustained attention. Ignoring these fundamental drivers means that short-term fiscal skirmishes do little to address the long-term structural imbalance.
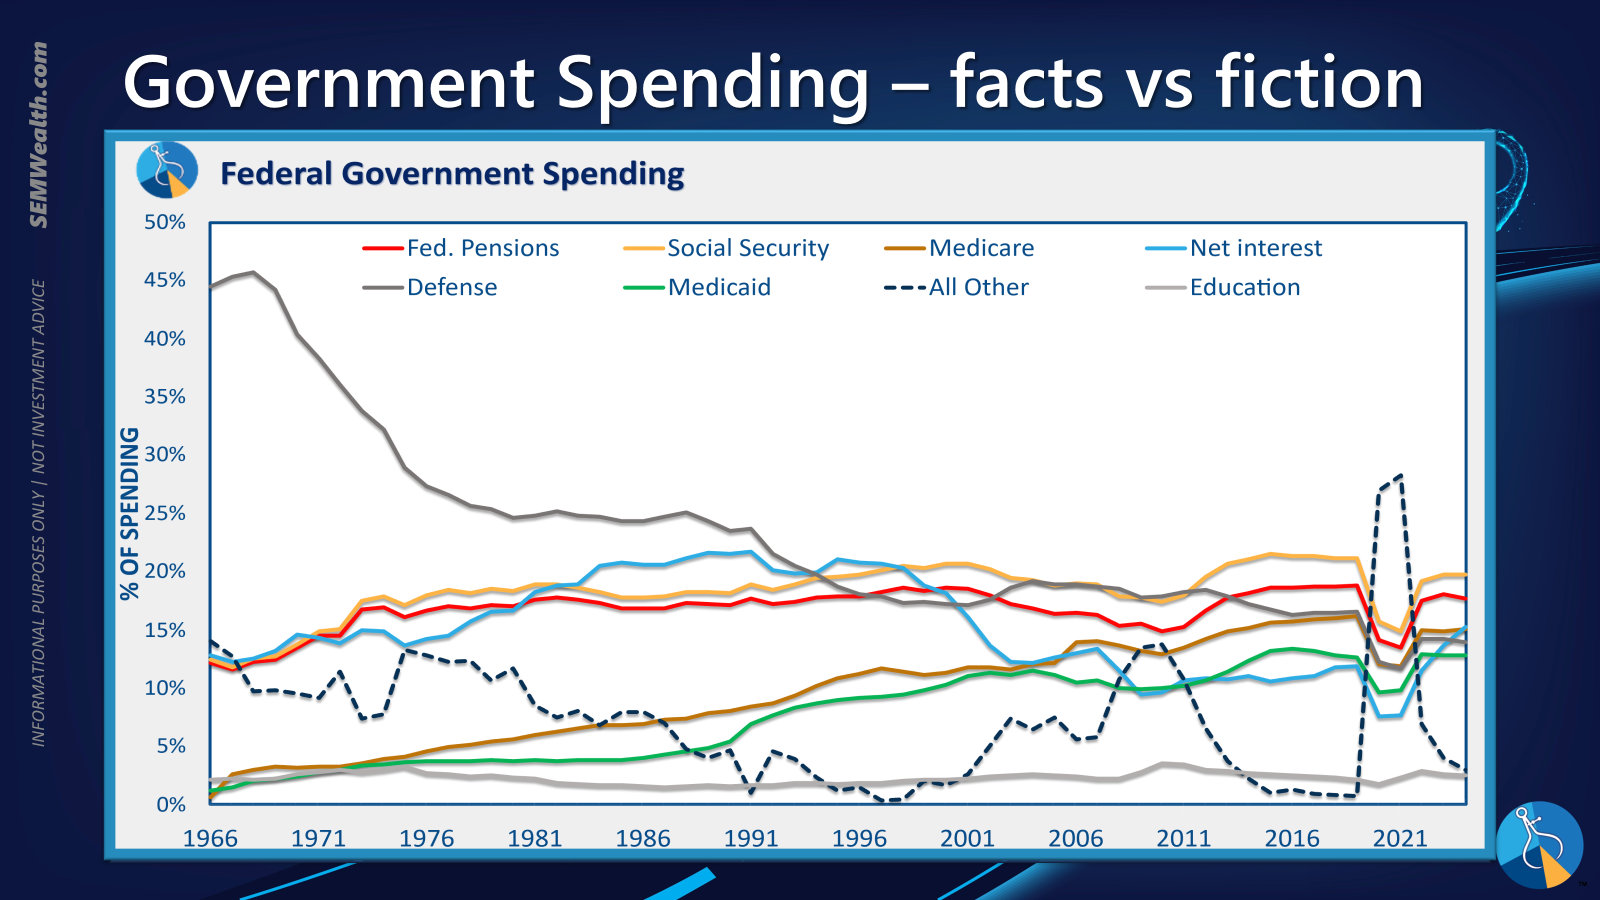
Further re-categorization simplifies the understanding of these allocations, providing a clearer picture of where the majority of national funds are directed.
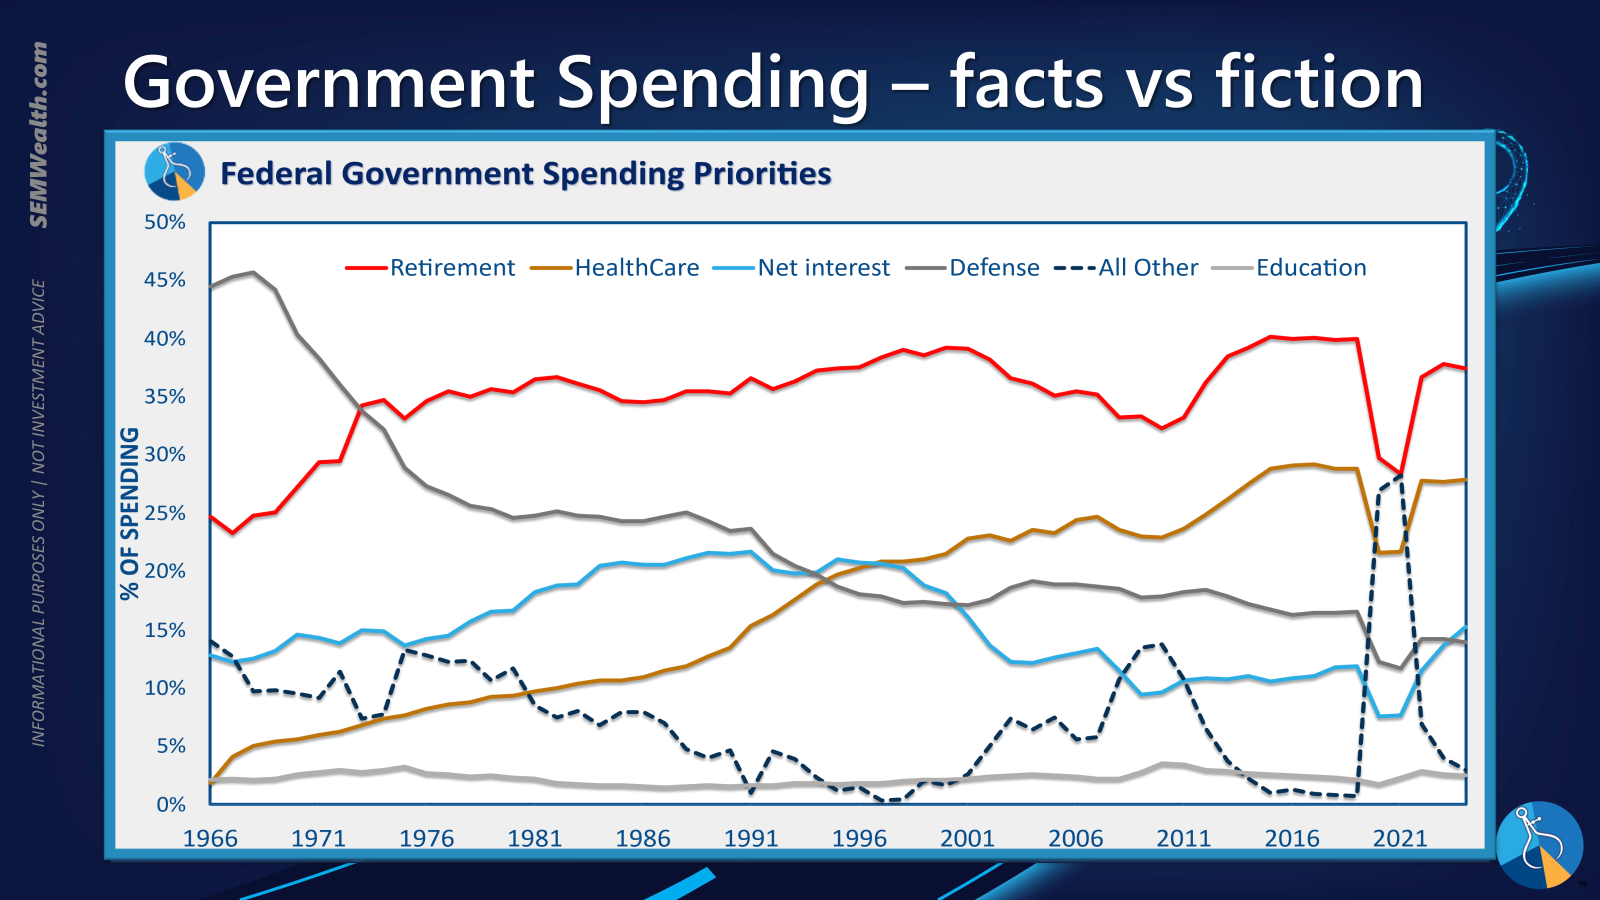
Ultimately, a streamlined view highlights that a significant proportion of public funds is allocated to support the retired population. This observation prompts a critical inquiry into potential correlations between demographic shifts and national fiscal health, emphasizing that current legislative battles often divert attention from the more substantial, underlying causes of the expanding deficit.
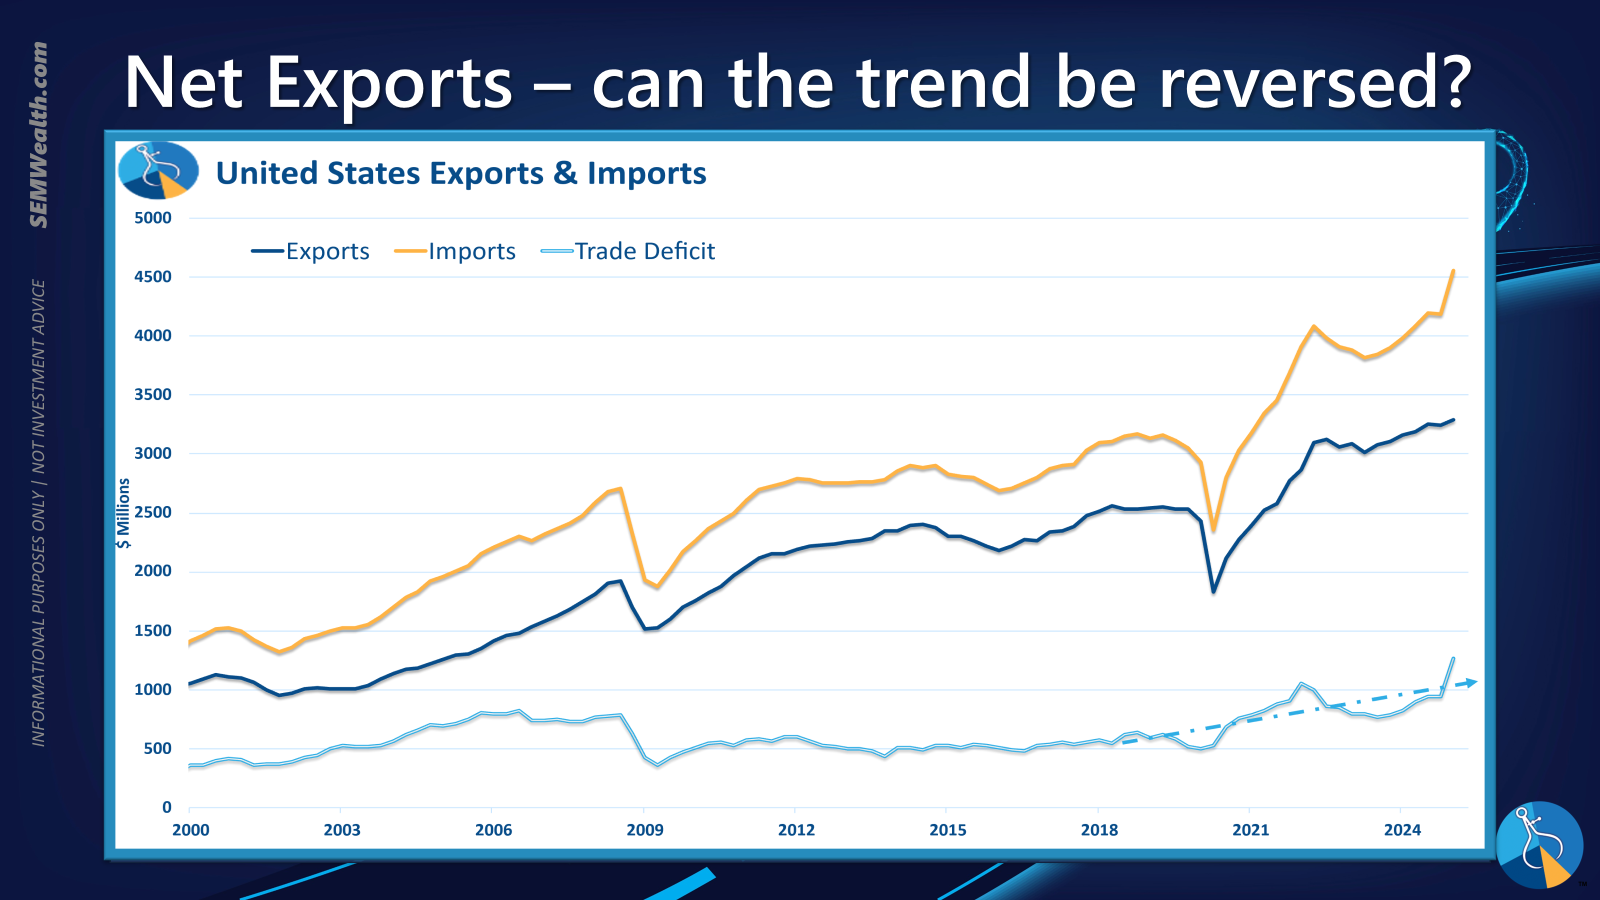
Trade Dynamics and the Impact of Tariffs
The volatility of international trade relations, exemplified by intermittent trade disputes and the imposition of tariffs, continues to influence global markets. Despite optimistic rhetoric regarding potential trade agreements, especially with key economic partners like China, and the implementation of sanctions against other nations, the actual economic ramifications are complex and often delayed.
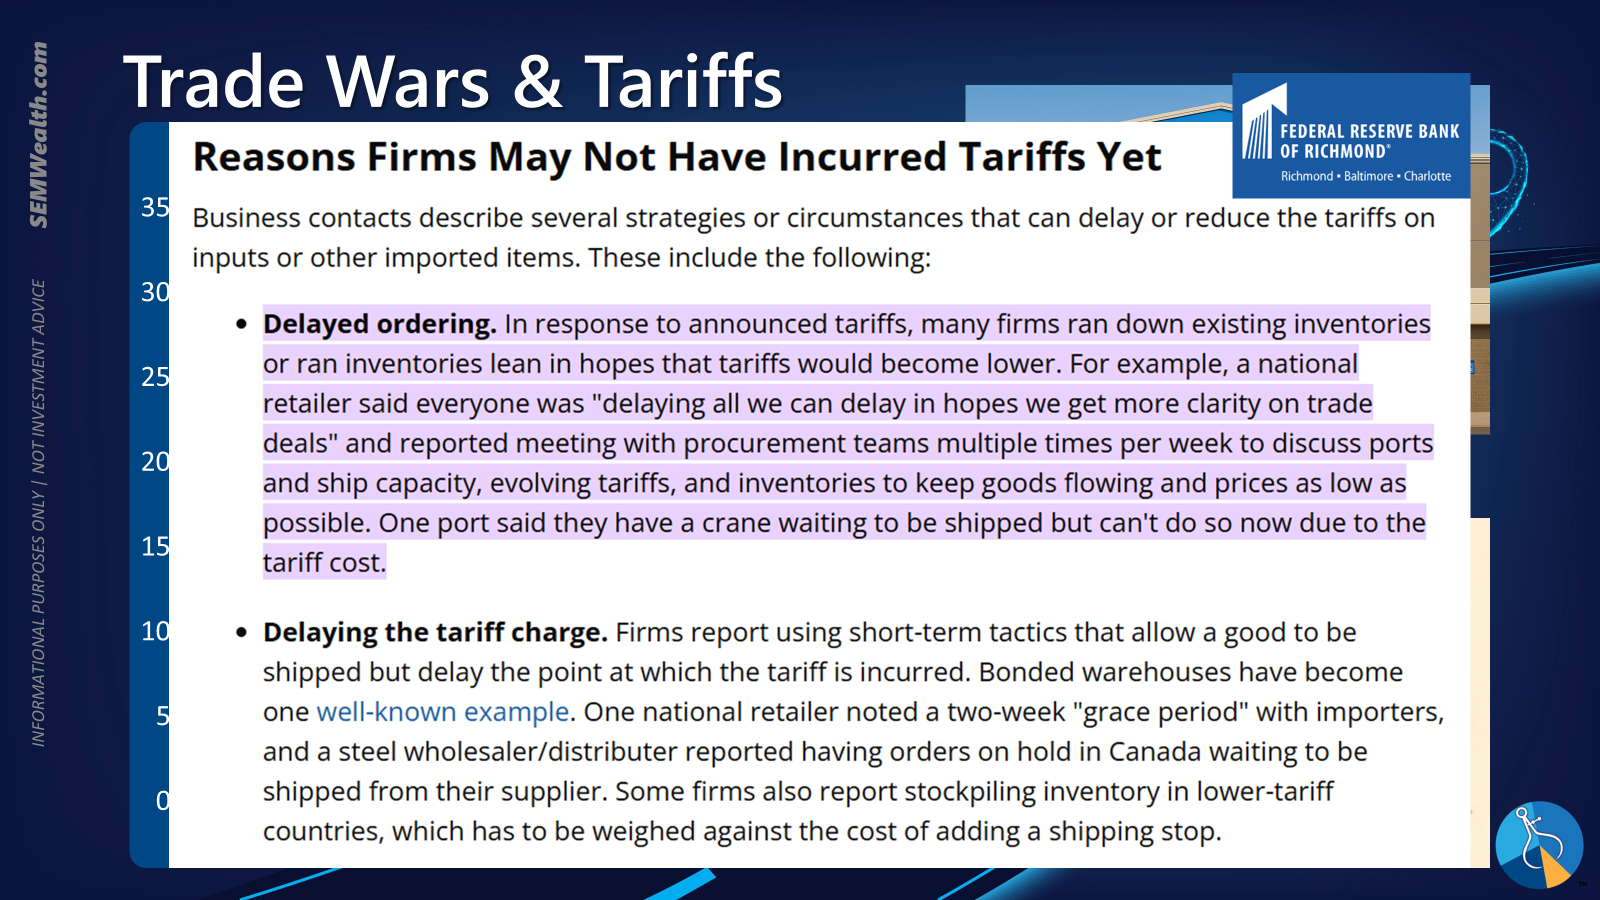
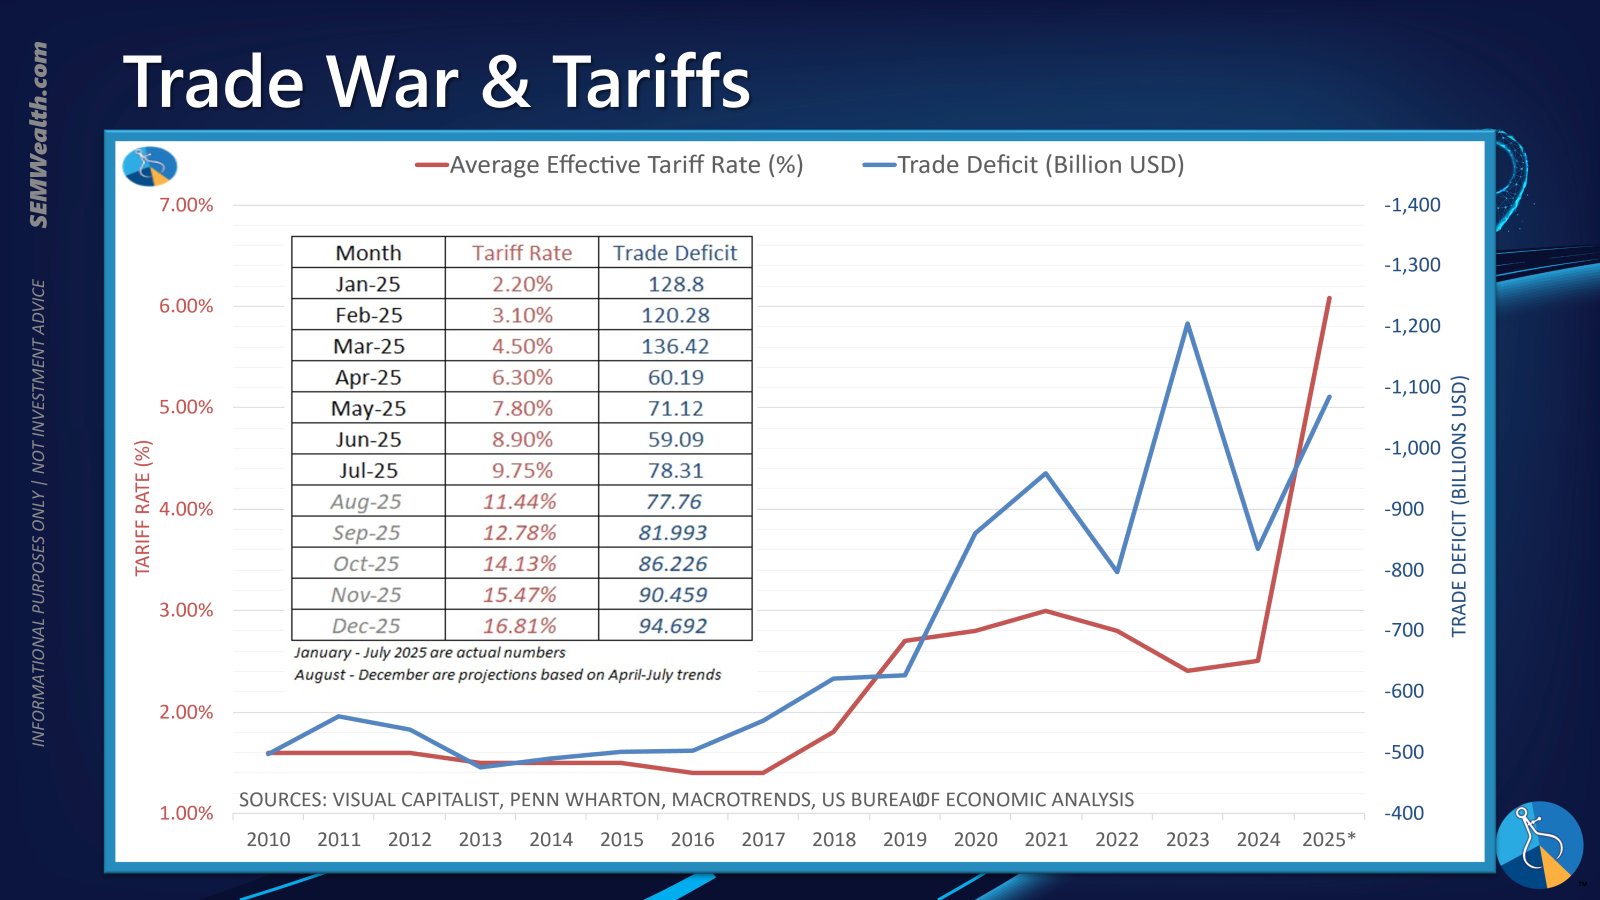
Initial data indicates an increase in the trade deficit, partly attributable to an anticipatory surge in imports ahead of tariff implementations. The full impact of these trade policies, particularly tariffs, is often not immediately apparent. Economic summaries from institutions like the Richmond Fed underscore that the real effects on domestic industries and consumer prices may unfold over an extended period. Historical analysis, particularly post-2010 with a notable increase in tariffs since 2018, suggests that such measures can introduce significant distortions into global supply chains and trade flows, with long-term consequences that are still evolving.
The Richmond Fed's summary further reminds us of the lagging effects of tariffs, suggesting that their full economic consequences are yet to materialize.
A historical perspective on tariff implementation since 2010, particularly the significant increases observed from 2018, reveals a pattern of evolving trade landscapes and their complex economic interplay.
AI and the Quest for Productivity Growth
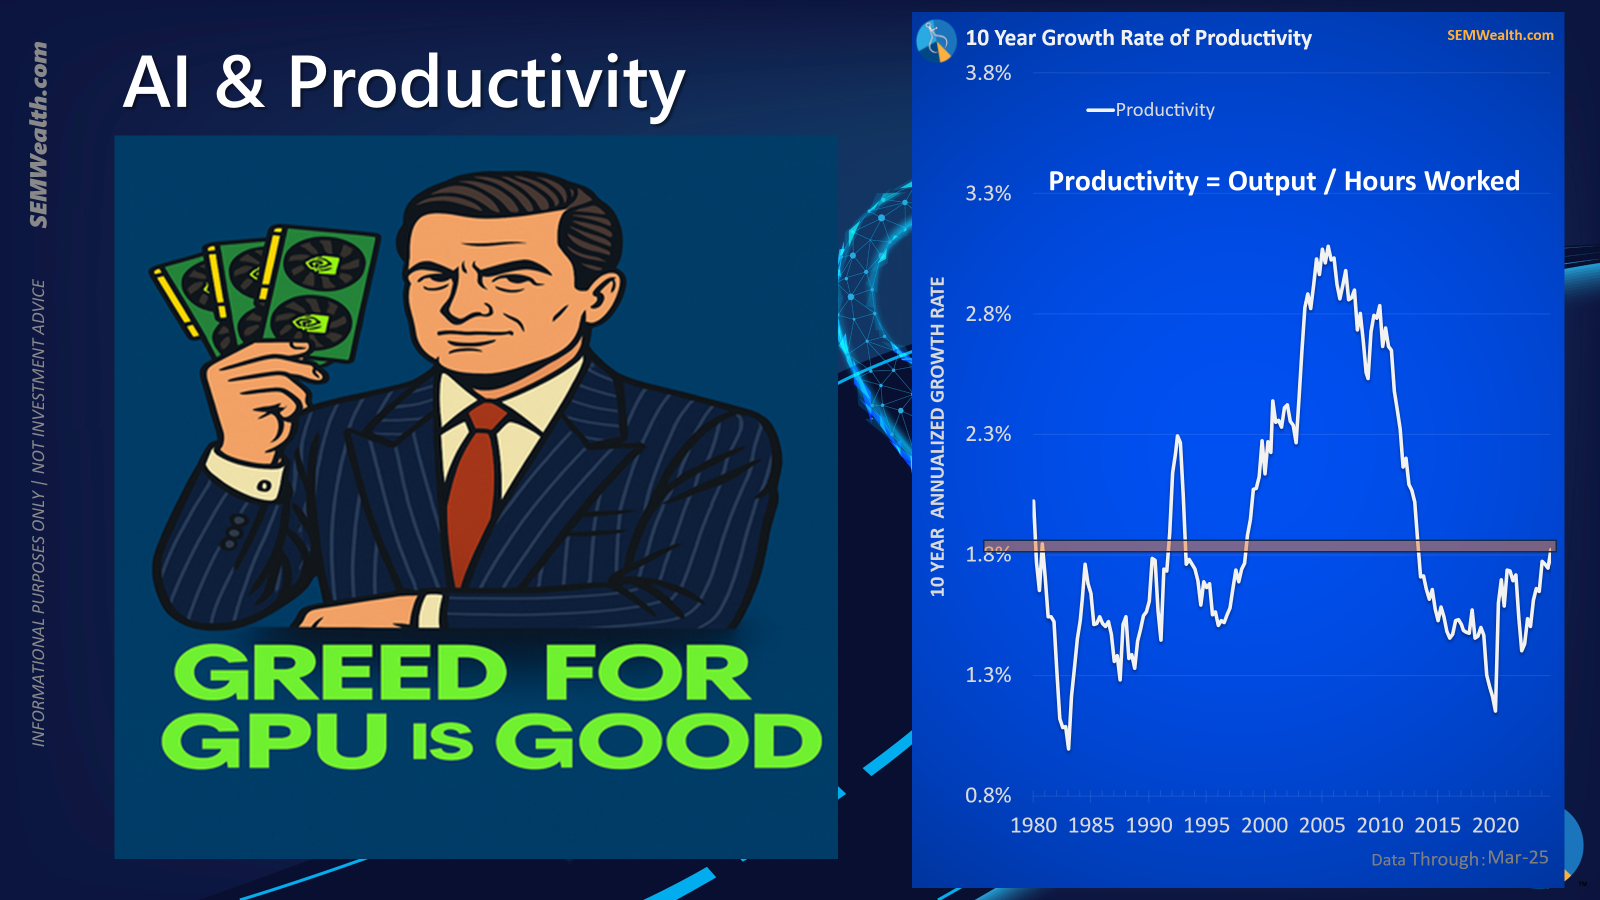
The discourse surrounding Artificial Intelligence (AI) has intensified, with daily advancements dominating technology news. A critical question for the economy and markets is whether the current unprecedented investment in AI will translate into a commensurate boost in productivity that justifies the substantial capital deployed.
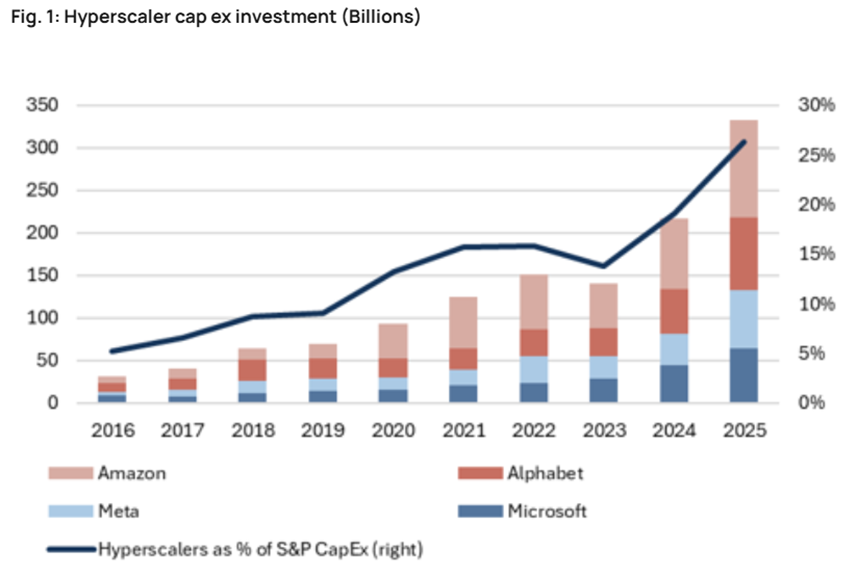
Estimates suggest AI-related spending could account for 4-5% of GDP this year, contributing an astounding 1-1.5% to annual growth. This significant contribution highlights AI's role in sustaining the current economic growth rate, which otherwise hovers just above 2%. Much of this investment originates from 'hyperscalers' – companies dedicating a large share of their operating cash flow to capital expenditures in AI infrastructure and development.
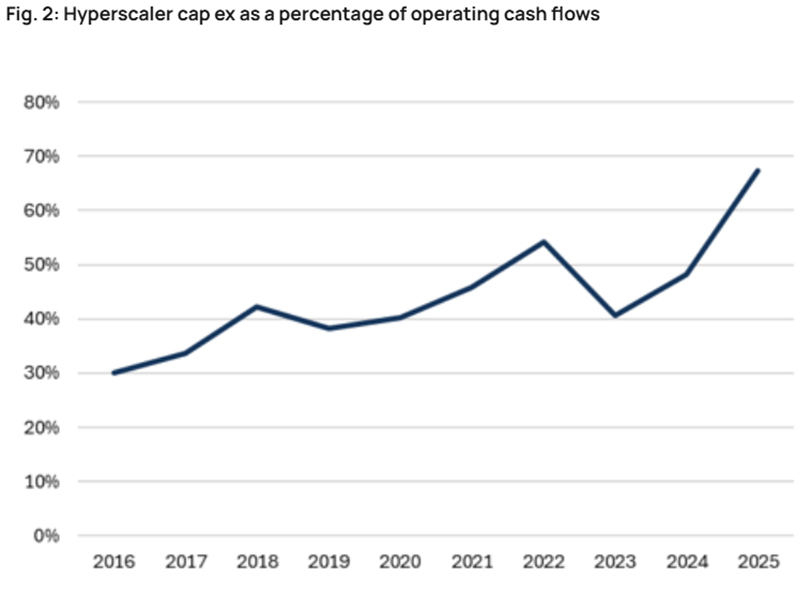
This situation evokes parallels with the late 1990s technology bubble. While often misattributed solely to 'dot-com' stocks, that era was fundamentally characterized by a massive buildout of internet infrastructure, from personal computing accessibility to high-speed internet. The promise of a 'new era' of productivity fueled unsustainable valuations and growth rates, particularly through 'vendor financing' and 'leasing' models. Although a genuine productivity boom did materialize, it did not prevent the subsequent collapse of many companies nor did it render their valuations sustainable. This historical context prompts a cautious perspective on current AI investments: while productivity gains are likely, the sustainability of current valuations amid intense capital expenditure remains a pertinent concern.
Market Outlook: Navigating 2026 Expectations
Forecasting market performance for 2026 involves contemplating two distinct scenarios, reminiscent of the late 1990s. The current market enthusiasm suggests the potential for a multi-year bull run, akin to 1997-1999. Even with stretched valuations and elevated expectations leading into 1999, major indices like the NASDAQ 100 doubled, and the S&P 500 gained nearly 40%. The Federal Reserve's accommodative stance then, partly due to Y2K concerns, provides a historical parallel to the current anticipation of a dovish Fed, especially with potential changes in leadership. Such conditions could indeed preface a phenomenal year for equity markets.
Conversely, the possibility of a market correction looms. Expectations are arguably excessively high, and underlying economic growth outside of AI capital expenditures shows signs of fragility, possibly pointing towards a recession. Current valuations are at or near all-time highs, in some metrics surpassing the 1999 peak. It's crucial to remember that the year 2000, despite high expectations, saw earnings hold up relatively well initially before the bubble burst.
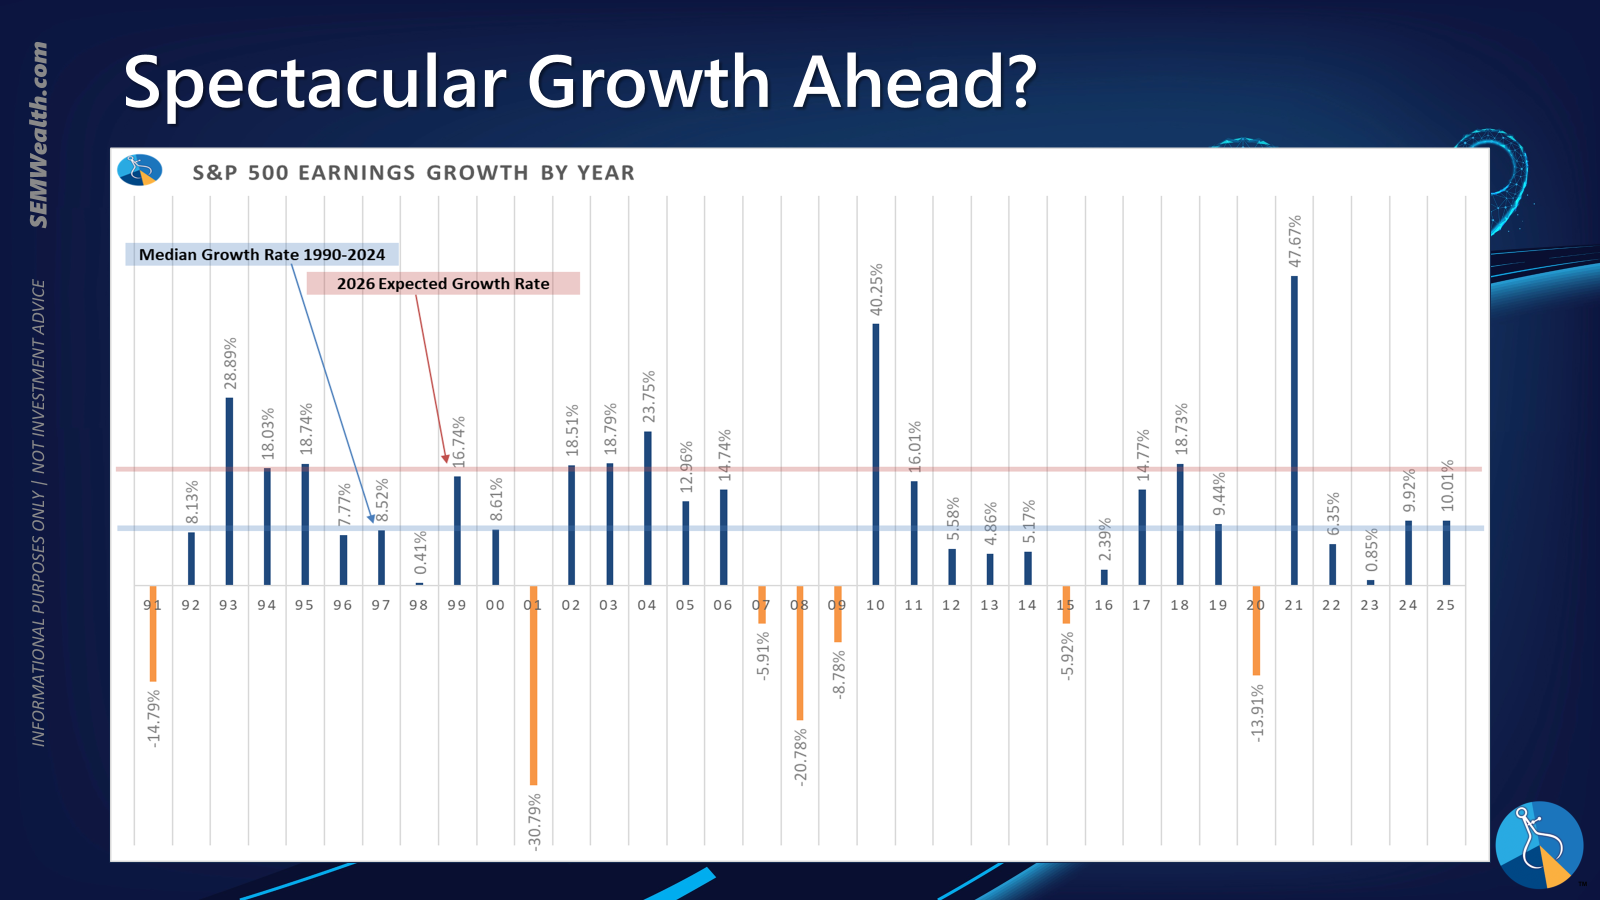
Analyst projections for earnings growth are currently double the long-term average, suggesting a rare trajectory seen only a few times in the past 35 years. While such growth is certainly achievable, investors must prepare for scenarios where these lofty expectations are not met. The implications of such a shortfall would be significant for market performance.
The Federal Reserve's Influence
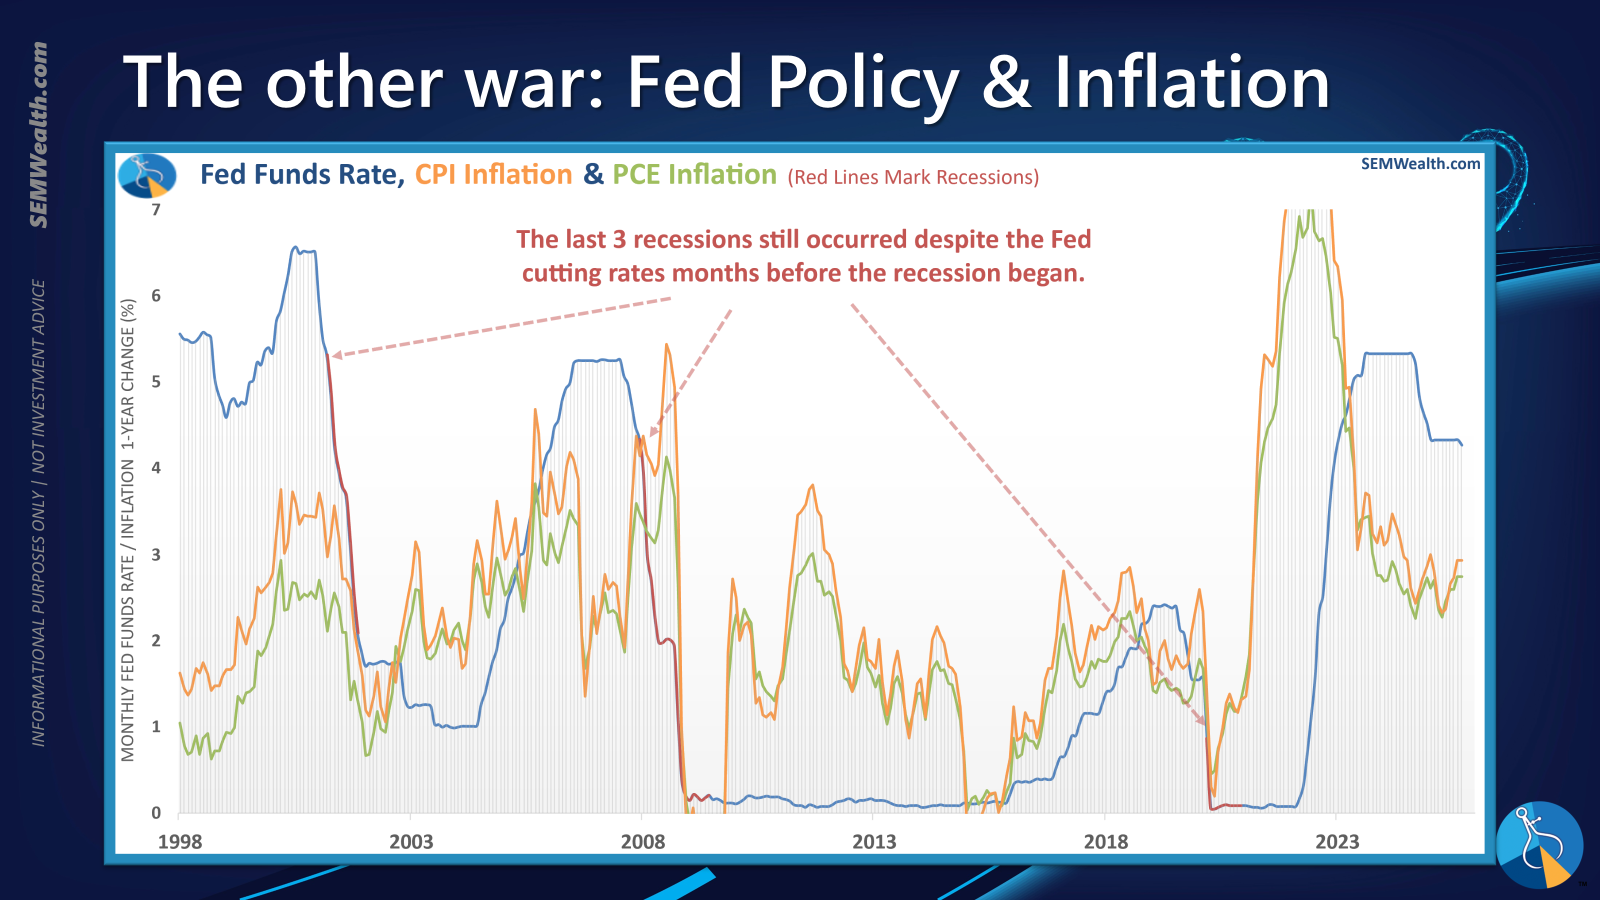
The Federal Reserve's monetary policy remains a critical determinant of economic direction. Recent Consumer Price Index (CPI) data, unexpectedly lighter, suggests room for the Fed to consider further rate cuts. This information, crucial for finalizing the Social Security Administration's cost-of-living adjustment, feeds into market expectations of easier monetary conditions.
However, it is imperative to acknowledge that Fed rate cuts do not inherently preclude a recession. Historical data consistently demonstrates instances where rate reductions have occurred concurrently with, or immediately preceding, economic downturns. This underscores the complexity of monetary policy's impact and the need for investors to remain vigilant against the assumption that easier money automatically guarantees economic expansion and market buoyancy.
Toby's Take: Weekly Wall Street Journal Insights
- Amazon Web Services Outage (10/20/2025): A significant AWS internet outage caused widespread disruptions, affecting numerous major websites and potentially leading to billions in lost sales. While a rebound is anticipated, the incident underscores the vulnerability of interconnected digital infrastructure.
- Sam Altman and OpenAI's Strategic Deals (10/21/2025): OpenAI, under Sam Altman's leadership, has successfully forged strategic partnerships with major tech giants, who are keen to invest despite the company not yet being profitable. This trend highlights a competitive rush to associate with OpenAI, hinting at future investment opportunities should the company go public.
- Charter Lays Off 1,200 Workers (10/22/2025): Cable and broadband provider Charter announced layoffs affecting 1% of its workforce due to declining subscriber numbers. This mirrors broader trends in the pay-TV industry, signaling a need for investors to re-evaluate holdings in such sectors.
- U.S. Lifts Missile Restriction on Ukraine (10/23/2025): The Trump administration's decision to lift restrictions on Ukraine's use of long-range missiles marks a significant escalation, enabling increased attacks within Russia. This move is intended to pressure Moscow towards ending the conflict and may positively impact defense sector investments.
- China's New Strategy for Trump (10/24/2025): Chinese President Xi Jinping has adopted a new strategy against President Trump, employing maximum pressure tactics, including a recent restriction on rare-earths vital to the U.S. tech economy. A forthcoming meeting is hoped to de-escalate the unpredictable trade war.
Market Performance & Investment Positioning
The past week concluded on a positive note for investors, particularly those with a significant allocation to technology stocks, with the S&P 500 registering an almost 2% gain despite a mid-week dip. The strong performance in certain sectors indicates a prevailing sentiment of economic resilience and an expectation of continued Federal Reserve support. From a broader perspective, the market maintains an upward trend, though the 'non-confirmation' from the Relative Strength Index (RSI) presents a lingering technical concern. Historically, the period transitioning out of October into November and December is often favorable for stocks, providing additional tailwinds.
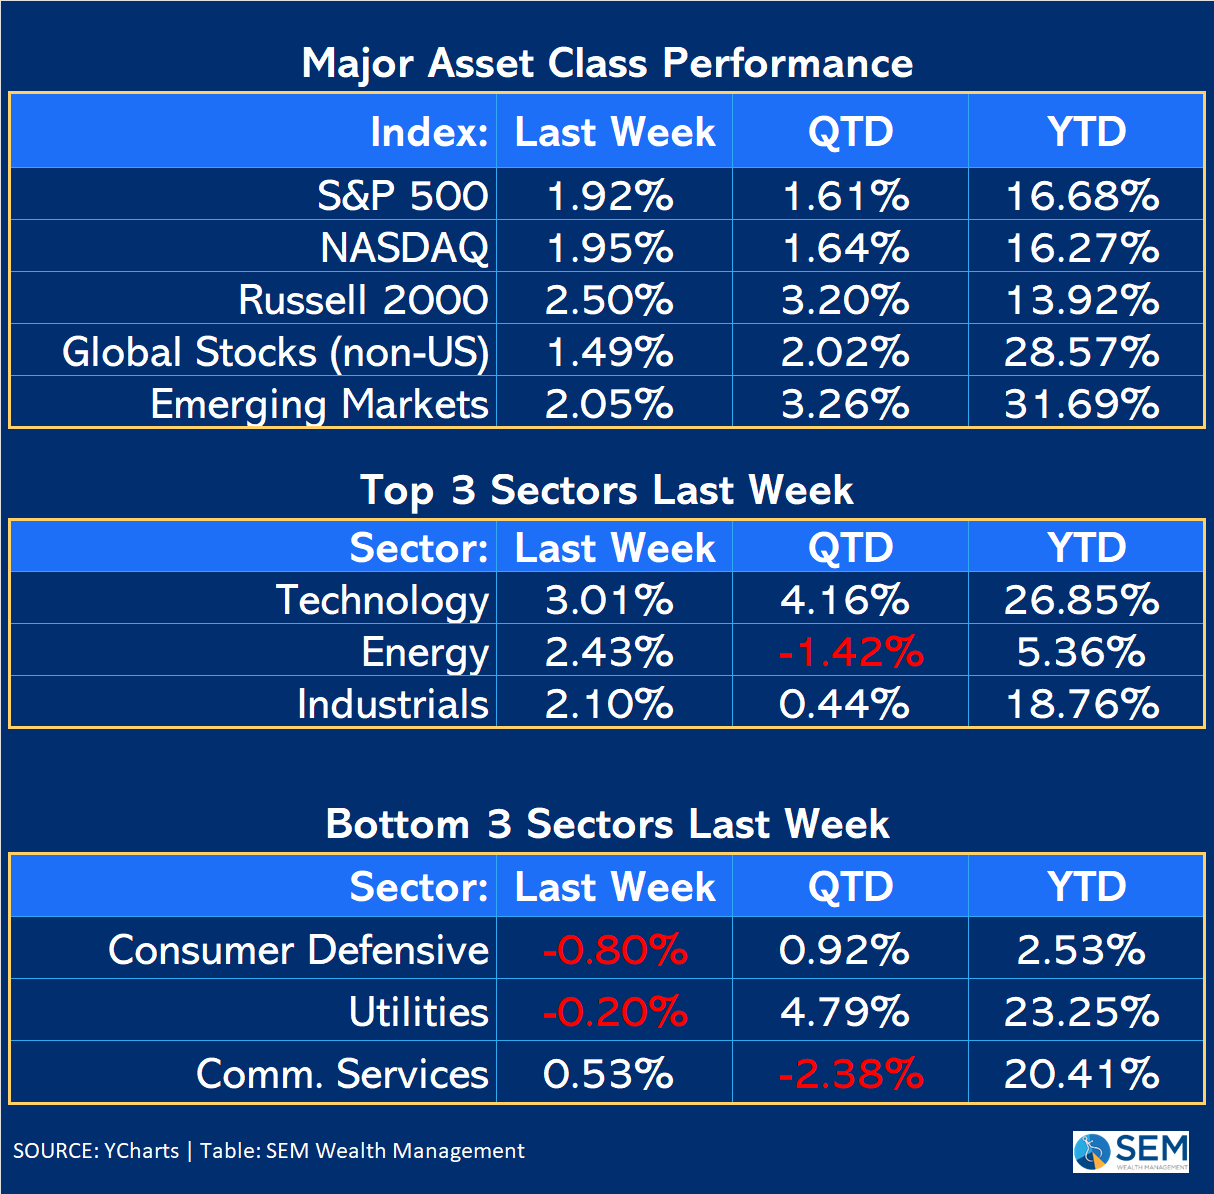
The performance of key sectors last week reinforced the perception of minimal recession risk and strong confidence in the Federal Reserve's capacity to intervene. This conviction underpins the current market behavior, particularly for those heavily invested in equities.
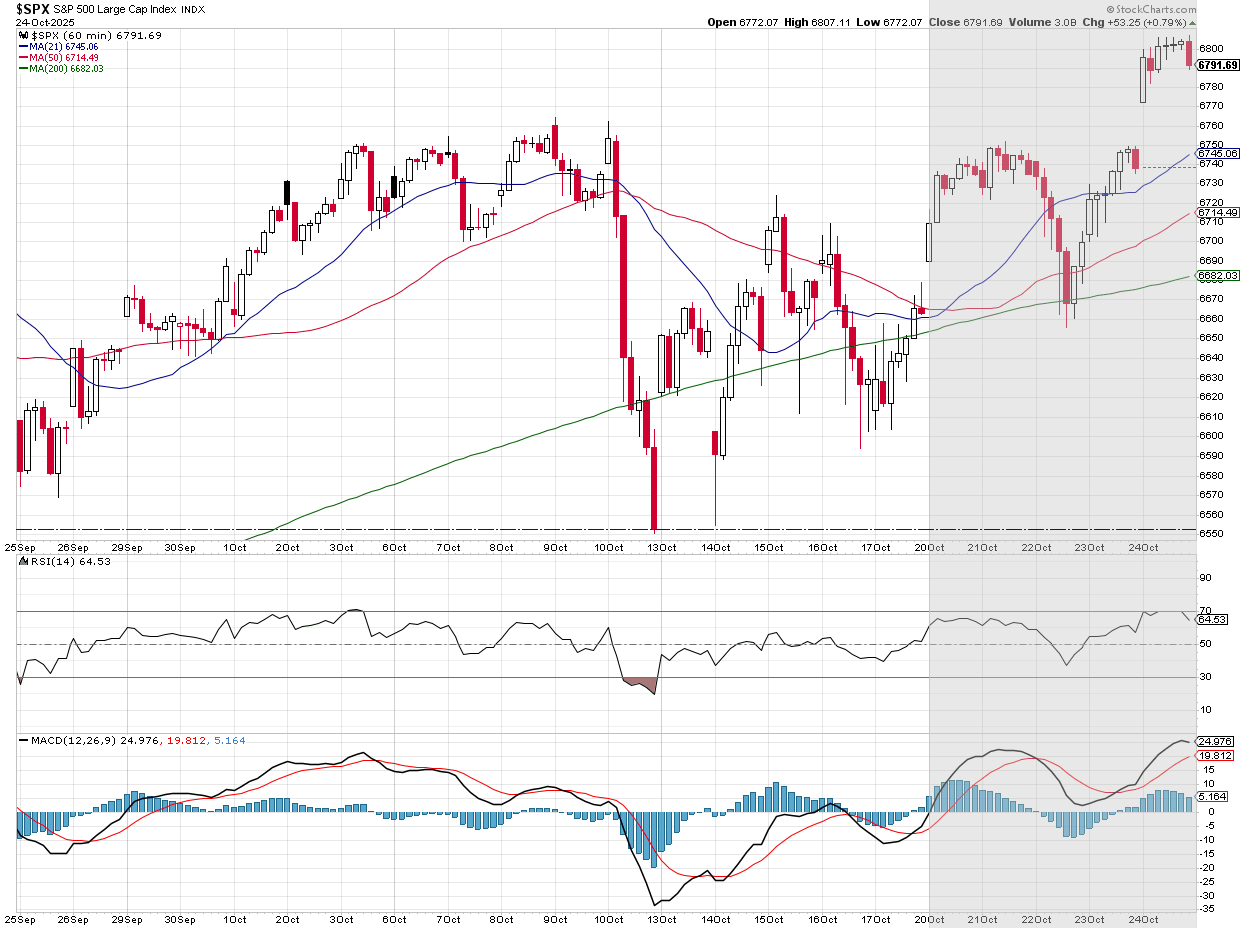
Despite the prevailing upward trend in the longer term, the market remains shadowed by the 'non-confirmation' signal from the RSI index, a technical indicator suggesting a potential divergence in momentum that warrants careful observation.
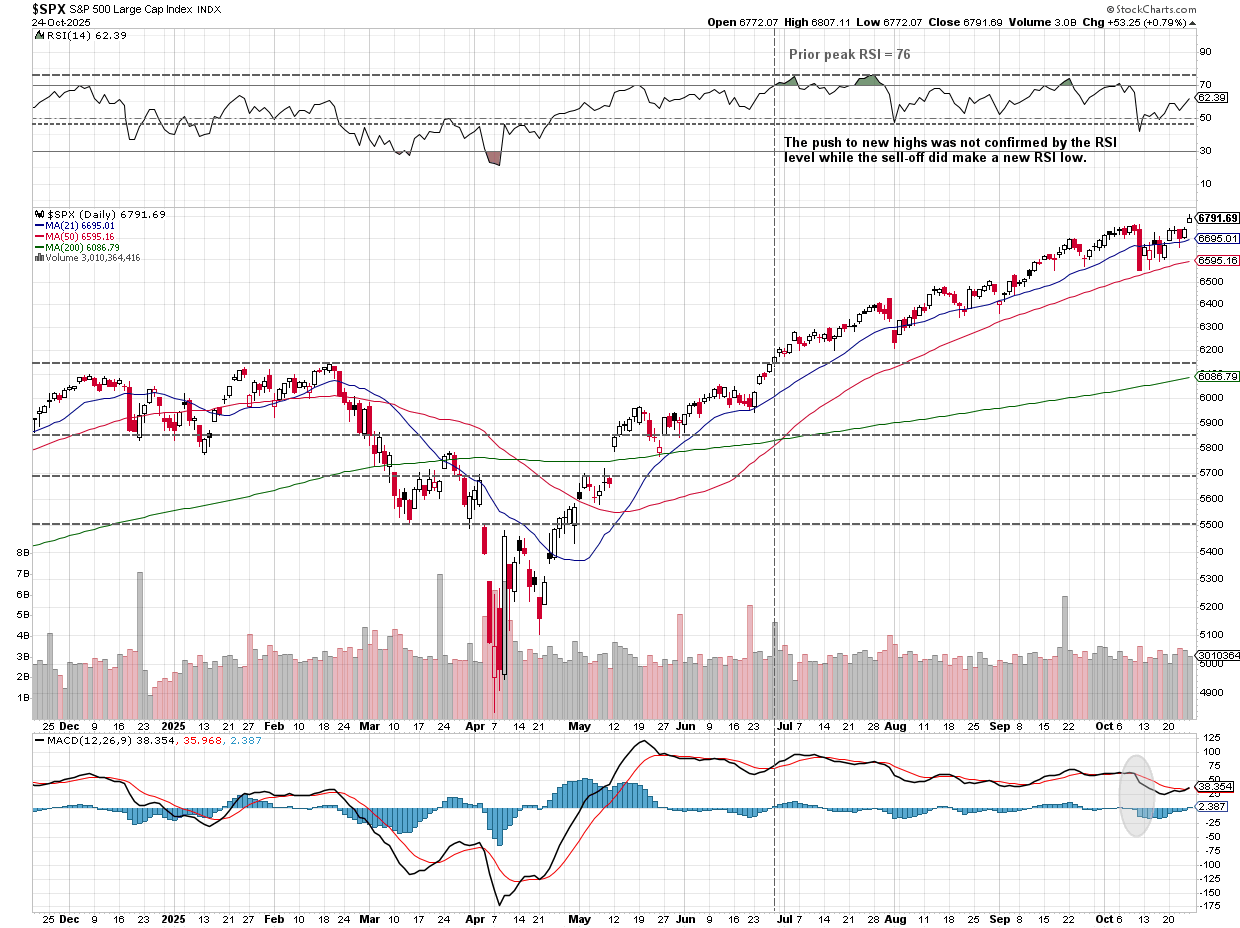
Nevertheless, the established uptrend persists, and as the calendar moves beyond October, the market anticipates two historically strong months for stock performance.
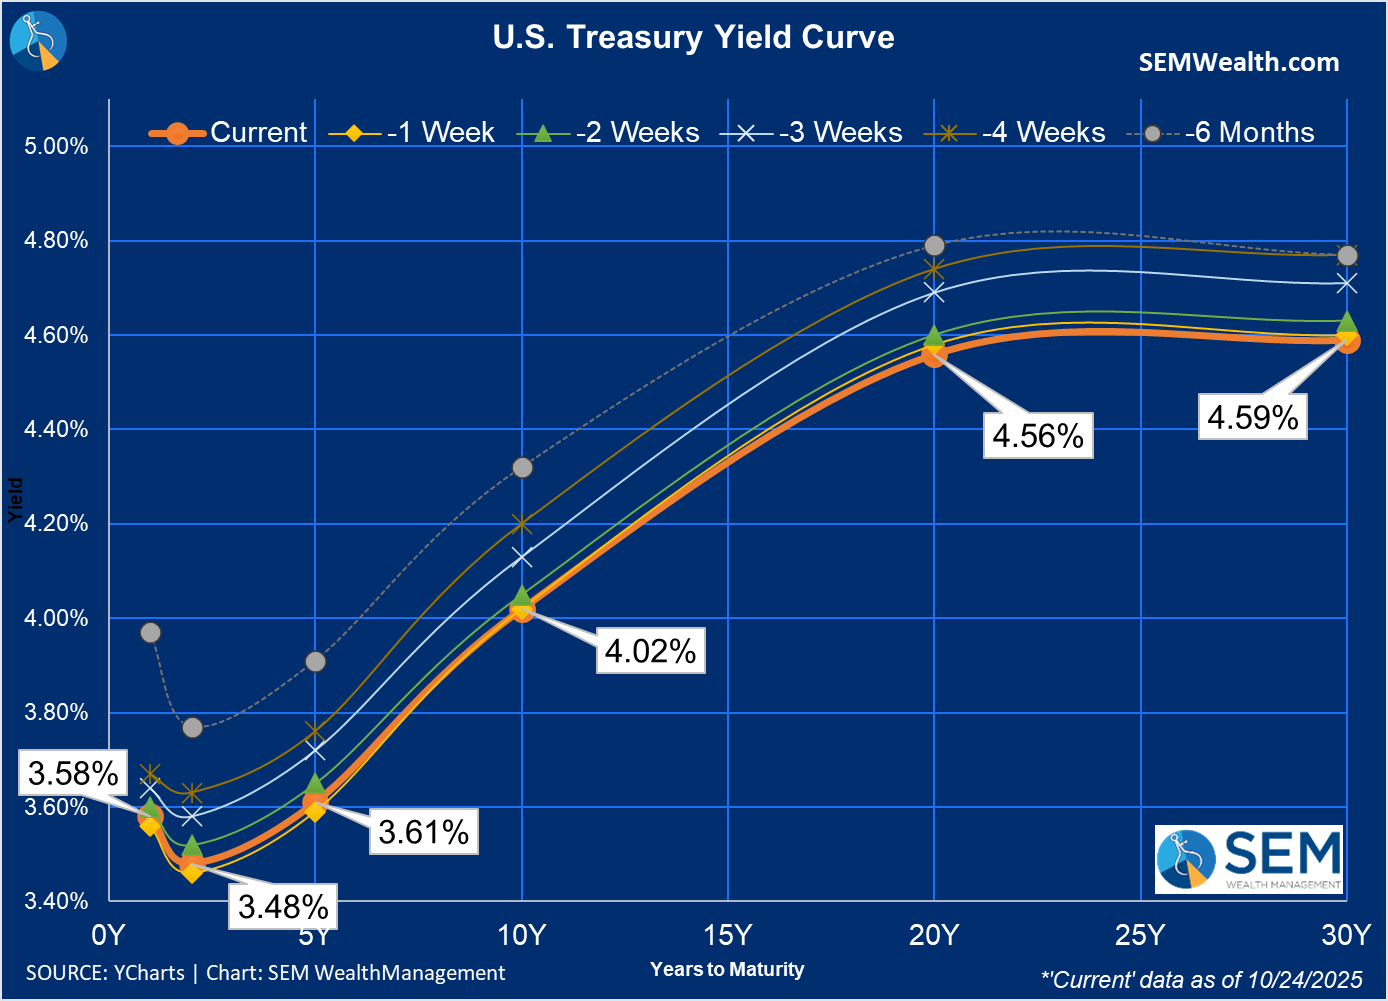
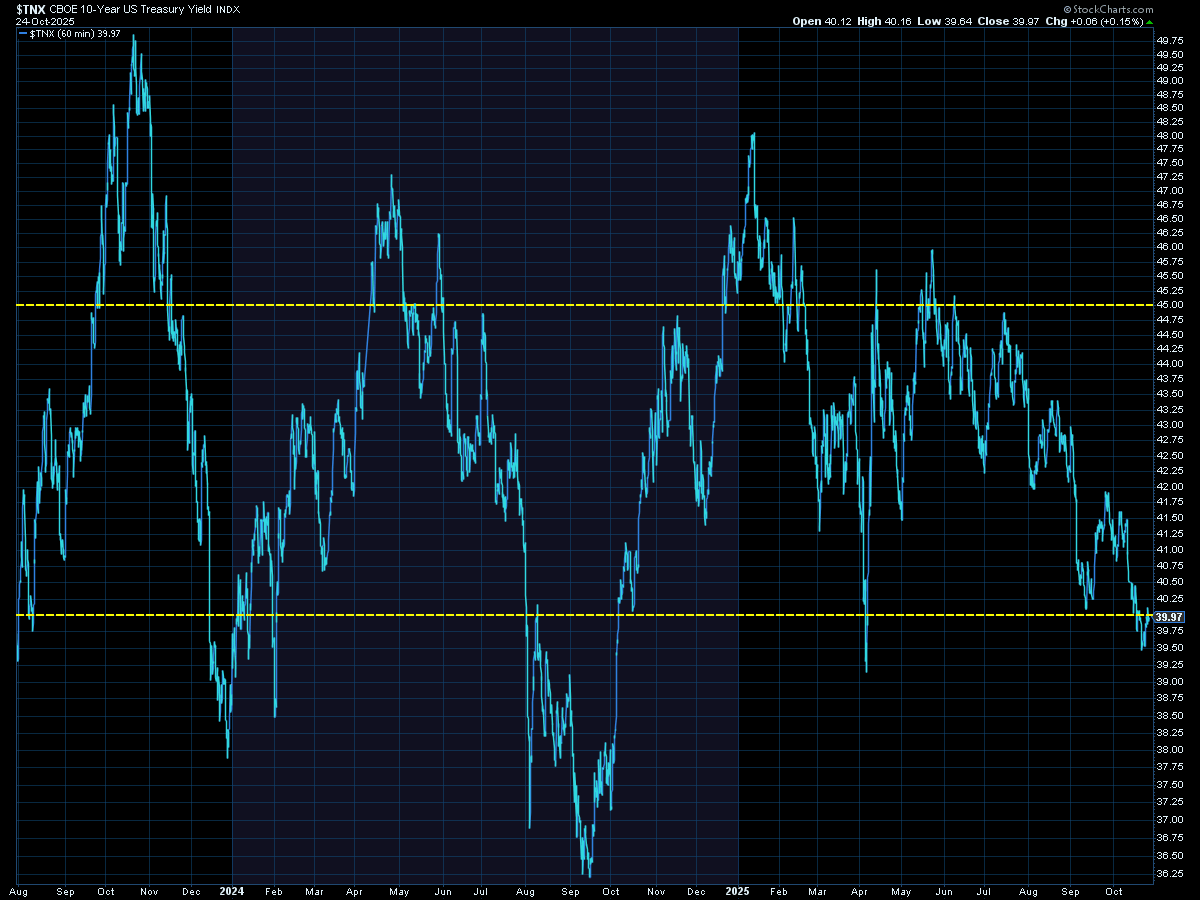
In the fixed-income market, the week was relatively calm, with bond yields largely stable across maturities. With bonds resting at the lower bound of the 4% range, the market's reaction to the upcoming Federal Reserve decision will be closely watched, as it could signal future direction for long-term yields.
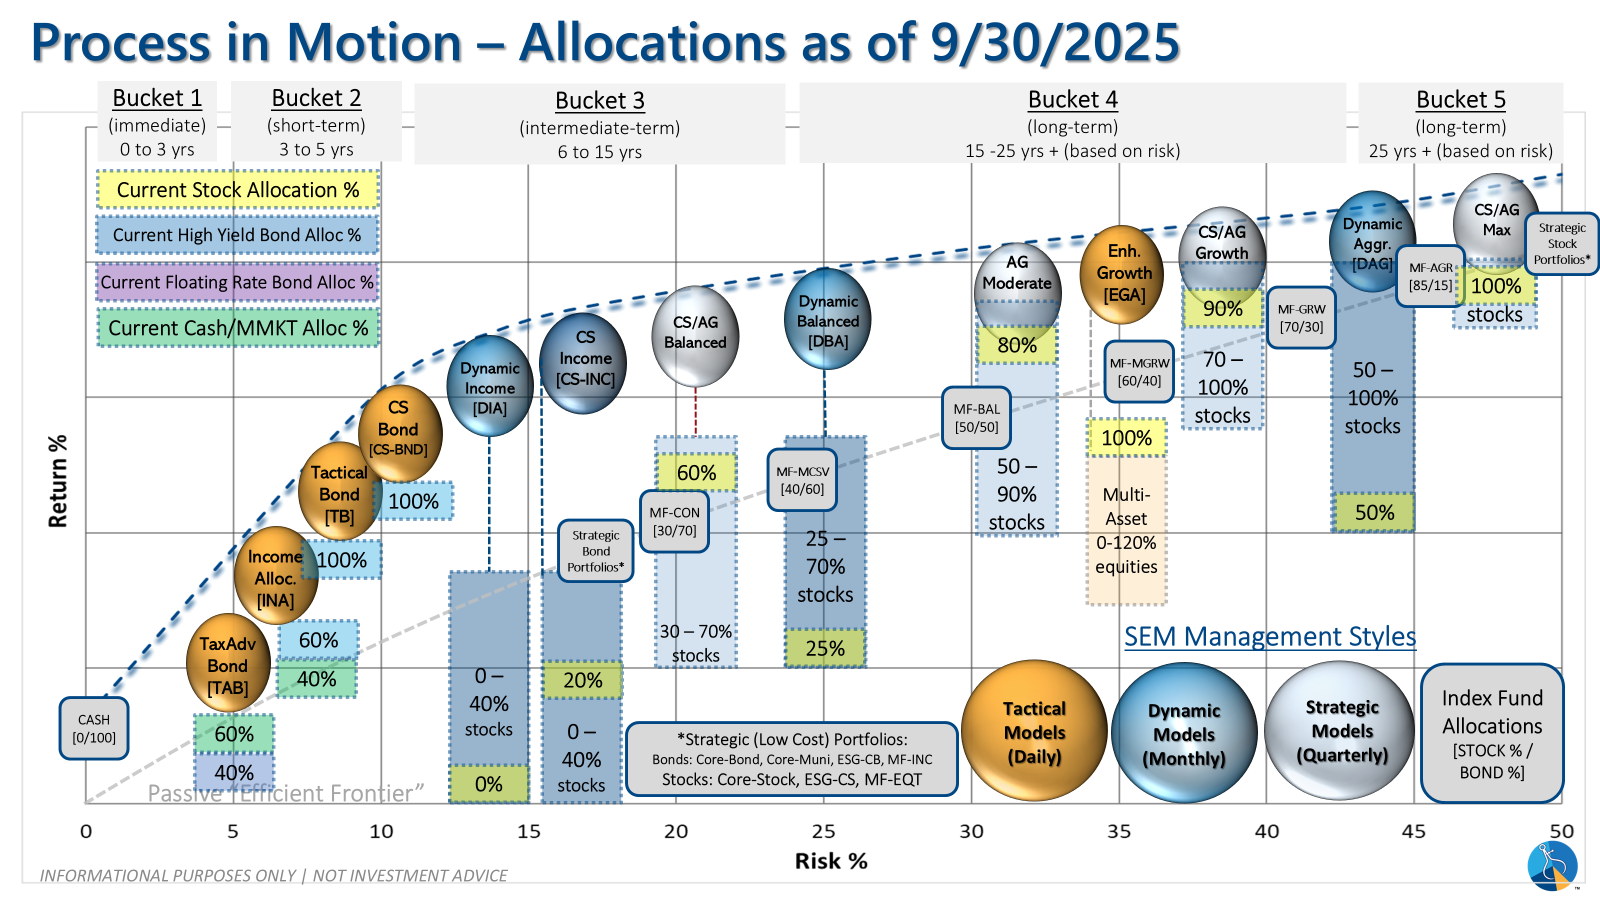
SEM Market Positioning
SEM employs three distinct investment strategies—Tactical, Dynamic, and Strategic—each calibrated for different response frequencies:
| Model Style | Current Stance | Notes |
|---|---|---|
| Tactical | 100% high yield | High-yield spreads holding, but trend is slowing-watching closely |
| Dynamic | Bearish | Economic model turned red – leaning defensive |
| Strategic | Slight under-weight | Trend overlay shaved 10 % equity in April -- added 5% back early July |
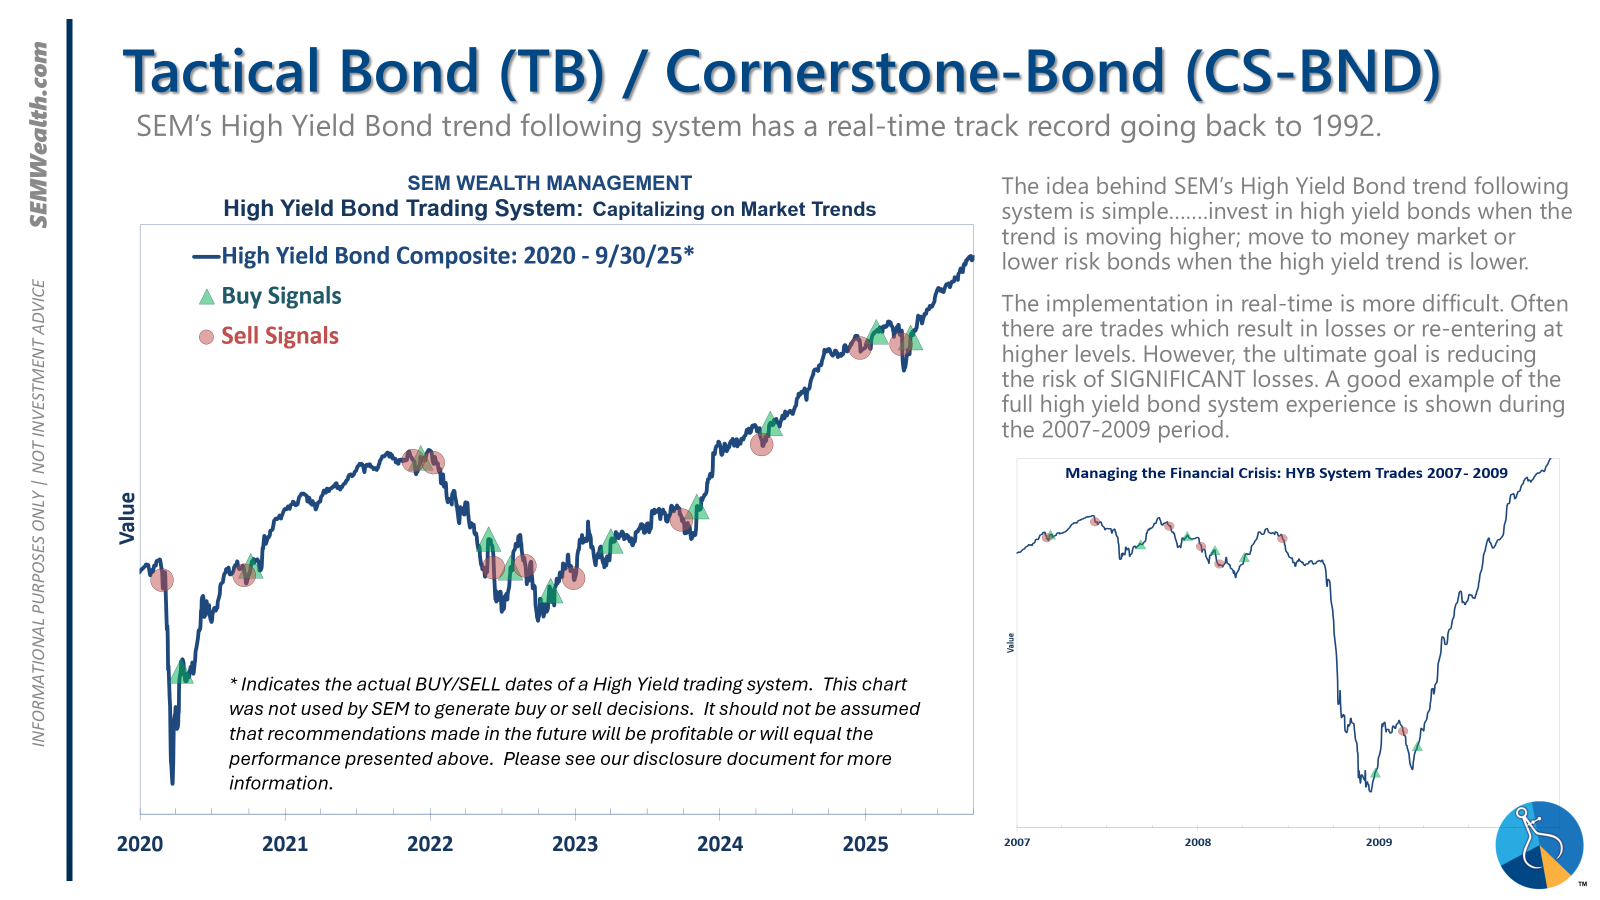
Tactical (Daily Adjustments)
The high-yield system has maintained an invested position since April 23, 2025, following a brief exit after a sell signal on April 3, 2025. While high-yield spreads are holding, their slowing trend warrants close monitoring.
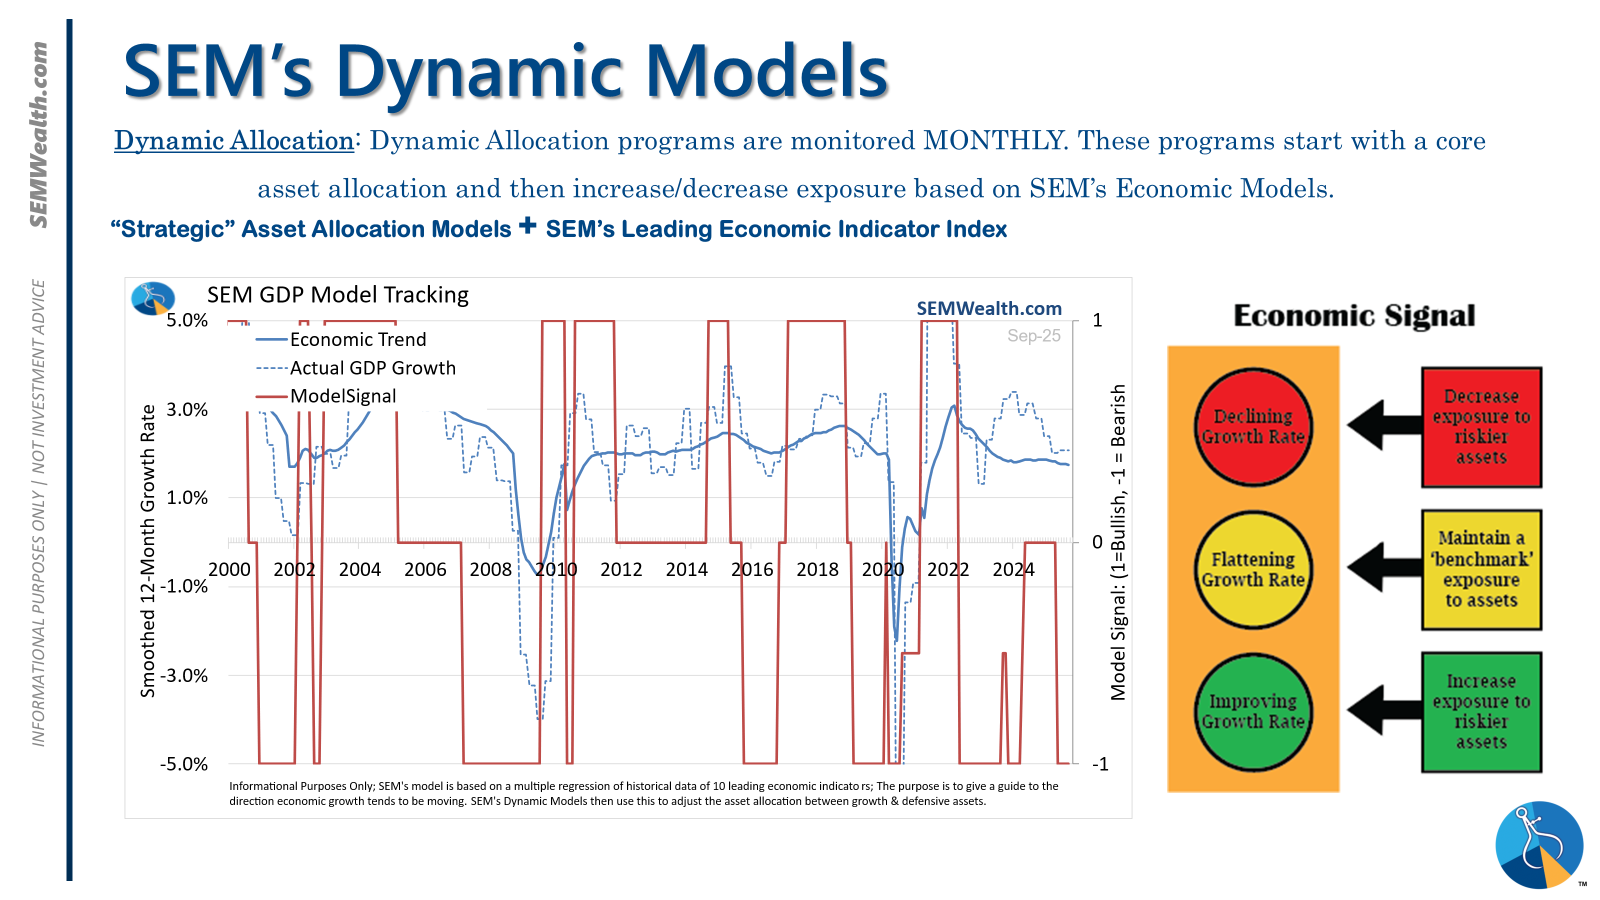
Dynamic (Monthly Adjustments)
This economic model shifted to a 'bearish' stance in June 2025, after an eleven-month 'neutral' period. This transition necessitates a defensive posture, divesting from risky assets such as dividend stocks in Dynamic Income and small-cap stocks in Dynamic Aggressive Growth. Concurrently, the interest rate model is 'bullish,' advocating for higher-duration (Treasury Bond) investments for the majority of bond allocations.
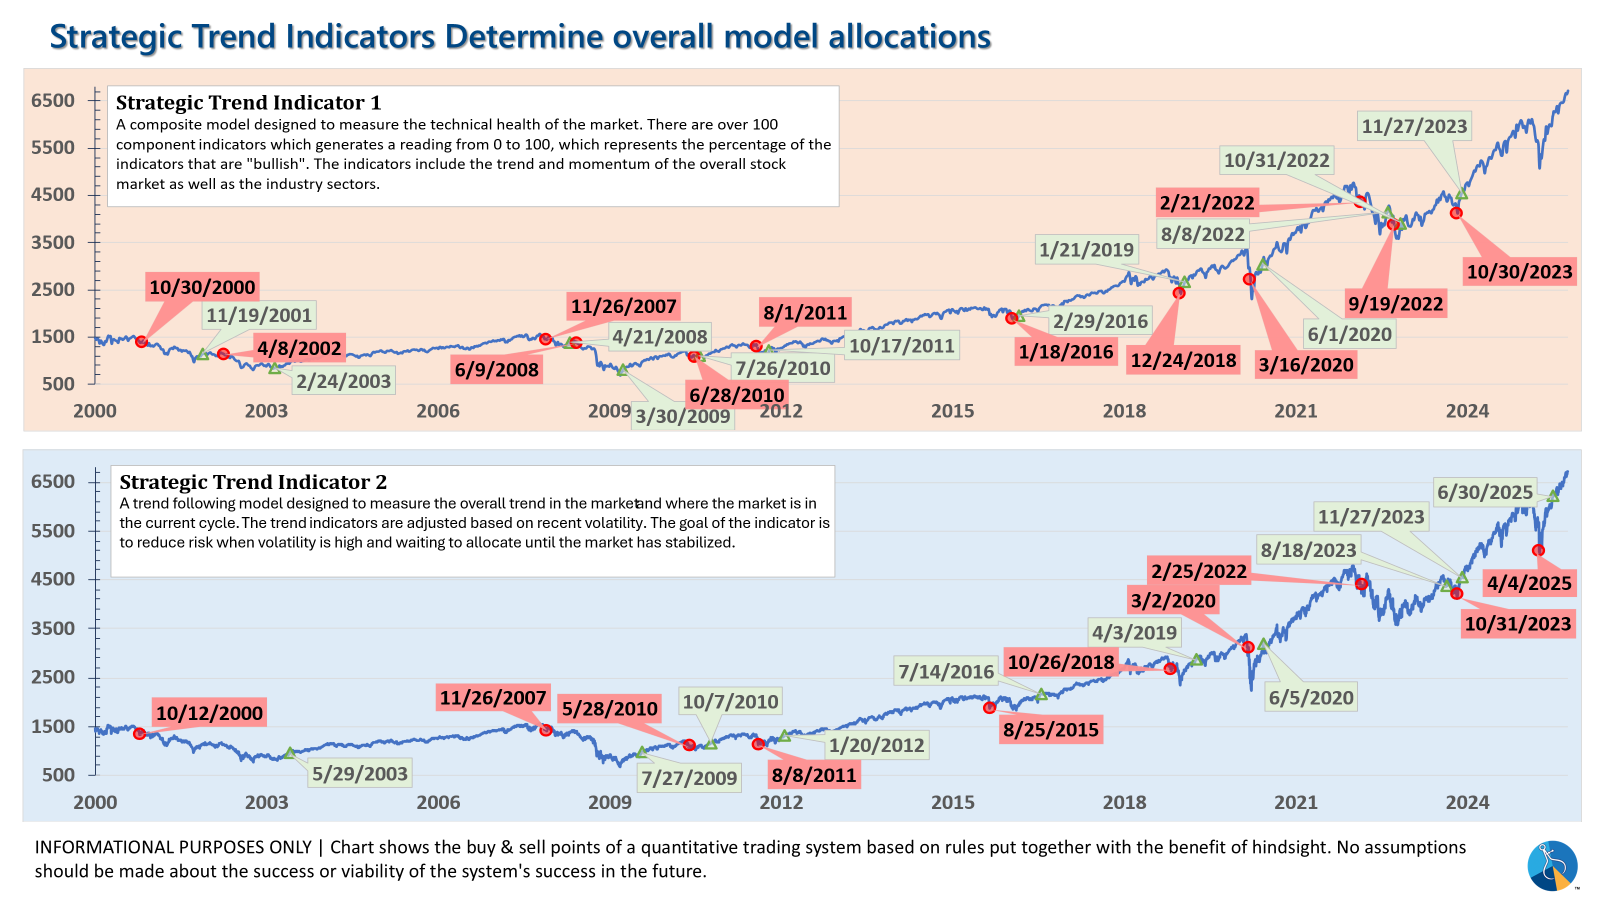
Strategic (Quarterly Adjustments with Trend Overlays)
The core rotation undergoes quarterly adjustments. Notable changes include a rotation out of mid-cap growth into small-cap value, and shifts within large-cap allocations to more diversified, actively managed blend and growth funds, aiming to broaden exposure beyond the top market leaders. The trend models within Strategic, while monitored daily, trade infrequently to mitigate major downturns. This system can experience 'whipsaws,' as seen with recent rapid sell and buy signals, yet its primary objective is capital preservation during significant market corrections. Given the market's substantial ascent throughout 2023, risks remain elevated, sometimes leading to premature selling. The quick reversals observed in recent trades demonstrate the system’s adaptive nature.
Overall, the varied stances of our models reflect a nuanced approach to current market conditions. Investors are encouraged to assess their personal risk tolerance and objectives to ensure alignment with their investment strategy.
Curious if your current investment allocation aligns with your overall objectives and risk tolerance? Take our risk questionnaire


