
SHIB at Critical Juncture: Defining Q4 2025 Price Trajectory
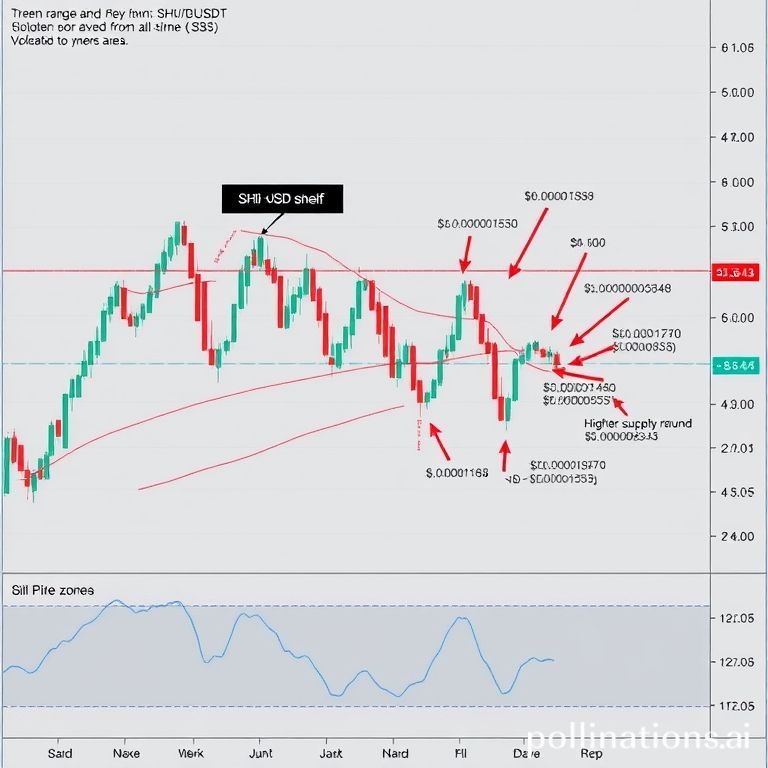
Shiba Inu (SHIB) currently finds itself at a pivotal point, according to a recent analysis by CryptoNuclear on TradingView. The popular meme coin is pressing against a significant multi-year demand shelf on its 6-day SHIB/USDT chart. This zone, delineated between $0.00000850 and $0.00001183, has historically proven to be a robust support level, consistently halting price declines since 2022 and shaping the asset's extended sideways consolidation. This critical area is now widely regarded as a "make-or-break" region; a sustained defense could pave the way for a substantial multi-leg advance, whereas a decisive breach could trigger a deeper market drawdown.
Macroeconomic and Structural Overview
From a broader structural perspective, Shiba Inu's price action continues to exhibit a series of lower highs originating from its all-time peak. This pattern fundamentally signals a persistent long-term control exerted by sellers in the market. Nevertheless, the consistent resurgence of buying interest within the $0.00000850 to $0.00001183 demand box indicates ongoing accumulation by various market participants. Furthermore, the 6-day candlestick formations have displayed a progressive compression into an increasingly tighter range. This phenomenon is a classic example of volatility contraction, a technical precursor that typically culminates in a significant price expansion in either direction. Given the narrowing range width and the repeated tests of this crucial support, the ensuing directional move is anticipated to be particularly sharp and impactful.
Key Upside Price Levels for SHIB
Should Shiba Inu successfully defend its current demand shelf, attention will shift towards critical overhead resistance levels. The immediate pivotal point for an upside breakout is identified at $0.00001580. CryptoNuclear's analysis emphasizes that a decisive 6-day closing price above this level, coupled with robust volume confirmation, would act as the initial trigger for impulsive buying intent. A validated breakout beyond this threshold would subsequently expose a stair-step progression of upside references, which correspond to prior supply zones encountered during last year's distribution phase. These targets are situated at $0.00001940, $0.00002400, and $0.00003338. Beyond these intermediate levels, a more substantial supply cluster exists between $0.00007870 and $0.00008836, marked on analysis charts as the "High" band. In the event of a significant macro reversal and sustained bullish momentum, this higher zone could act as a longer-horizon magnet, where considerable profit-taking activities would logically be anticipated.
Potential Downside Scenarios and Support Levels
Conversely, a failure to successfully defend the established accumulation base would fundamentally alter the market narrative. A decisive breakdown through the $0.00000850 level, particularly if accompanied by expanding trading volume, would invalidate the current range thesis and shift the market's focus dramatically. In such a scenario, the next meaningful liquidity pocket and downside checkpoint is identified at $0.00000543, annotated as the "Low" on CryptoNuclear's chart. Acceptance of price action beneath this critical threshold would significantly increase the risk of capitulation dynamics, potentially leading to the formation of new cycle lows. This risk is amplified by the observable lack of dense historical trading activity between these lower price points, which implies weaker support in the event of a breakdown.
Market Positioning and Outlook
Current market positioning naturally bifurcates based on these critical levels. Optimistic dip-buyers perceive the $0.00000850–$0.00001183 area as a region of significant value, presenting a favorable risk-to-reward proposition. Their conviction, however, is predicated on the market's ability to reclaim and subsequently hold above the $0.00001580 level, effectively converting it from resistance into robust support, thereby sustaining a trend continuation sequence. In contrast, cautious participants acknowledge the symmetrical nature of risk: the same price compression that can fuel powerful breakouts also possesses the potential to instigate severe breakdowns. These traders advocate for a defensive stance, prioritizing capital preservation should a daily-to-weekly close occur beneath the established floor. Neutral traders, adopting a more measured approach, maintain patience. They await clear confirmation via a 6-day closing price action, whether definitively above $0.00001580 or below $0.00000850, before committing significant capital.
In conclusion, Shiba Inu is presently coiled at a historically significant base that is poised to determine its macro trajectory extending into 2025–2026. A respectful adherence to the demand support keeps the recovery track intact, aiming for targets such as $0.00001940, $0.00002400, and $0.00003338. A more ambitious runway into the broader $0.00007870–$0.00008836 supply envelope could materialize if positive momentum broadens across the market. Conversely, a loss of this fundamental base would unequivocally hand control back to sellers, with $0.00000543 serving as the primary downside checkpoint. For both long-term investors and agile swing traders, the confluence of the $0.00000850–$0.00001183 demand zone and the reaction around the $0.00001580 overhead resistance are the critical levels demanding close observation.


