
Ethereum Surges to $4,400: Will Bulls Continue the Rally?
Ethereum's Ascent: Analyzing the Push Towards $4,400
The cryptocurrency market has recently witnessed a notable resurgence in Ethereum's valuation, initiating a steady upward trajectory beyond the $4,320 threshold. As of now, ETH is undergoing a period of consolidation, a crucial phase that could either precede further significant advances or signal a pause in its impressive rally. The immediate focus for market participants is the critical $4,400 resistance level, a breach of which could pave the way for an extended bullish run.
Key Market Movements and Technical Breakouts
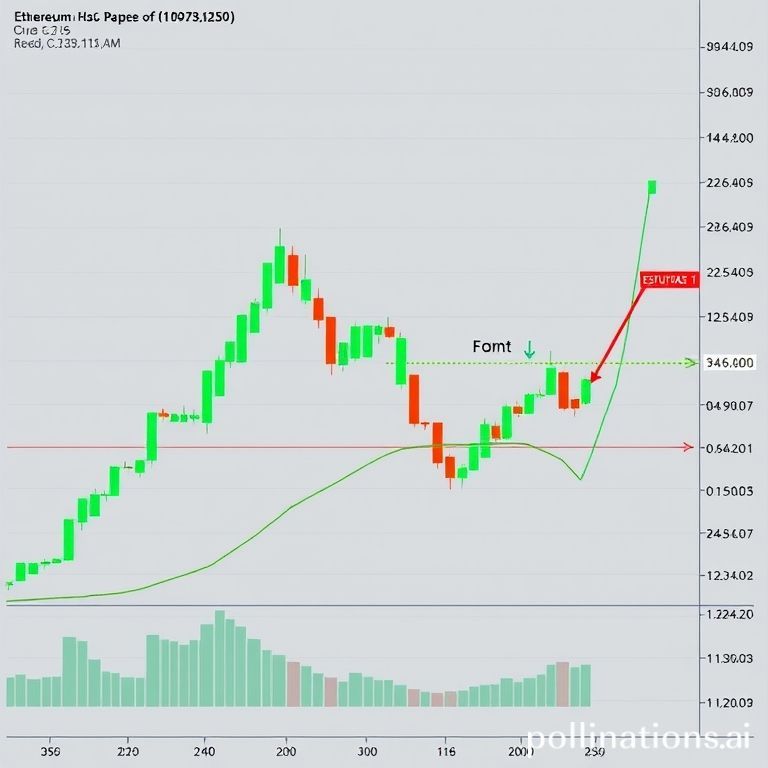
Ethereum’s resilience has been a defining characteristic of its recent performance, maintaining a robust stance above the $4,250 mark, thereby setting the stage for a strong recovery wave. This upward momentum mirrored similar trends observed in major cryptocurrencies like Bitcoin, underlining a broader positive sentiment across the digital asset landscape. A pivotal moment in this recovery was the decisive breakout from a significant contracting triangle pattern, identified on the hourly chart of ETH/USD, which had established resistance around $4,180. This technical break, coupled with trading comfortably above the $4,320 level and the 100-hourly Simple Moving Average (SMA), underscored the increasing strength of the bullish sentiment.
The price action saw a direct surge towards the $4,400 psychological barrier, demonstrating the market's conviction. Despite reaching this high, Ethereum’s price has managed to sustain its position above the 23.6% Fibonacci retracement level, calculated from the upward swing originating at the $4,093 low to the recent $4,400 peak. This stability at a higher level is often interpreted as a sign of underlying strength, suggesting that the initial gains are being defended by buyers.
Examining Upside Trajectories and Resistance Levels
Presently, Ethereum is fluctuating above $4,350, with the 100-hourly SMA acting as a dynamic support. The immediate challenge for the bulls lies at the $4,400 resistance level. Overcoming this barrier is paramount for sustaining the current upward momentum. Should ETH successfully establish a foothold above $4,400, the next significant resistance point is projected around $4,420. A sustained push beyond these immediate obstacles could unlock further upside potential, with subsequent targets identified near the $4,500 psychological mark.
A clear and convincing breach above $4,500 would likely ignite further buying interest, potentially propelling the price towards the $4,550 resistance zone. The momentum could extend even further, targeting the $4,650 region, a break of which might signal a more aggressive continuation of the rally. In such an optimistic scenario, Ether could realistically aim for the $4,720 resistance zone, with an ultimate target of $4,800 in the near to medium term, reflecting a robust and sustained bullish trend driven by strong market fundamentals and technical indicators.
Potential Setbacks and Critical Support Zones
Conversely, the failure to breach the $4,400 resistance level could precipitate a fresh wave of selling pressure, leading to a decline. The initial line of defense on the downside is situated near $4,320. A breach below this level would bring the more substantial support zone around $4,250 into play. This level has previously demonstrated its capacity to act as a pivot point, and its integrity is crucial for preventing a deeper correction.
Should the price fail to hold above $4,250, the momentum could shift decisively in favor of bears, pushing Ethereum towards the $4,200 support. Further sustained losses might see the price retreating towards the $4,120 region, which aligns closely with the earlier breakout point of the contracting triangle. In an extended bearish scenario, the next critical support could be found near $4,050, highlighting a potential reversal of the recent gains and a return to previous trading ranges. Traders will be keenly watching these support levels for signs of stabilization or further breakdown.
Technical Indicators: A Closer Look
An examination of key technical indicators offers further insights into Ethereum’s current market posture:
- Hourly MACD (Moving Average Convergence Divergence): The MACD for ETH/USD is currently exhibiting a positive trajectory, gaining momentum within the bullish zone. This configuration typically suggests that the short-term moving average is rising faster than the long-term moving average, indicating increasing bullish momentum and buying interest in the market.
- Hourly RSI (Relative Strength Index): The RSI for ETH/USD has moved above the 50 zone. An RSI reading above 50 generally indicates that the asset is experiencing upward momentum, suggesting that bullish forces are more dominant than bearish ones. While not yet in overbought territory, this position signals strength in the current rally.
Concluding Outlook
Ethereum’s journey above $4,320 has been marked by strong technical breakouts and sustained bullish sentiment. While the immediate focus remains on the $4,400 resistance, the underlying technical indicators suggest a predisposition towards continued upward movement, provided key resistance levels are systematically overcome. However, the market remains dynamic, and a failure to consolidate above critical thresholds could easily trigger a corrective phase. Investors and traders are advised to monitor the major support and resistance levels closely, as these will dictate the trajectory of Ethereum in the immediate future.


