XRP Price Under Pressure: A Deeper Dive into Potential Bearish Trends

XRP Faces Downward Momentum: Is a Larger Bearish Wave on the Horizon?
The cryptocurrency market has recently observed XRP initiating a new downturn, slipping below the significant $3.00 threshold. This movement indicates increasing bearish sentiment, suggesting that XRP’s valuation might experience further declines, potentially breaching the $2.880 support zone. This article delves into the current technical indicators and price action to understand the possible trajectory of XRP in the near term.
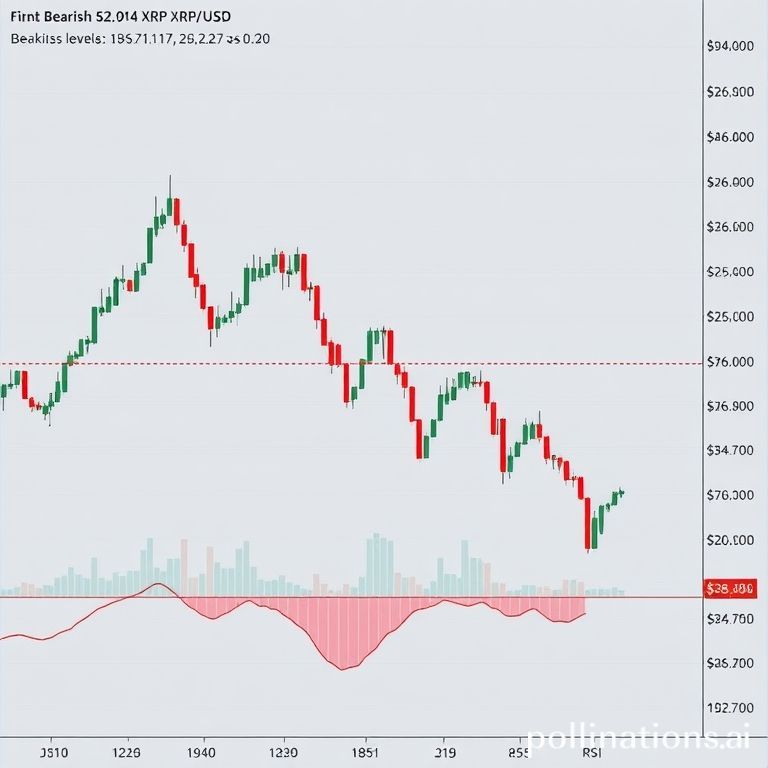
Currently, XRP’s price is trading considerably lower, having moved decisively below the crucial $3.00 support level. The digital asset has also fallen beneath the $2.950 mark and is now positioned below its 100-hourly Simple Moving Average (SMA), a key indicator often used by traders to gauge short-term trend direction. Furthermore, a discernible bearish trend line is taking shape on the hourly chart of the XRP/USD pair, with a clear resistance point identified around $2.980. This trend line signifies a consistent pattern of lower highs, reinforcing the prevailing bearish outlook. Should the price continue its downward trajectory and decisively break below $2.880, it could indeed pave the way for a more substantial bearish wave across the market.
Price Action and Key Support Levels
In recent trading sessions, XRP's price struggled to sustain its momentum above $3.20, mirroring similar retreats seen in other major cryptocurrencies like Bitcoin and Ethereum. This inability to hold higher ground led to a fresh wave of selling pressure, pushing XRP below critical support levels at $3.050 and $3.020. The bears successfully asserted dominance, driving the price below the psychological $3.00 mark. A temporary low was established close to the $2.880 support level, and the asset is presently consolidating these losses, trading well below the 23.6% Fibonacci retracement level. This retracement is calculated based on the recent decline from the $3.138 swing high to the $2.880 low, indicating that the current price level represents a relatively weak recovery attempt.
The persistent trading below $3.00 and the 100-hourly Simple Moving Average further solidifies the bearish outlook. The aforementioned bearish trend line on the hourly chart, with its resistance at $2.980, acts as a significant hurdle for any potential upward movements. However, if the bulls can muster sufficient strength to protect the $2.880 support level, there remains a possibility for the price to attempt another upward correction. This level is crucial for preventing a more significant breakdown, as its breach could accelerate selling.
Resistance Points and Potential Upside Scenarios
Looking at the upside, XRP's price is likely to encounter initial resistance near the $2.950 level. A more substantial challenge for buyers will emerge around the $3.00 level, which also coincides with the bearish trend line. A decisive breakout and a sustained move above this $3.00 resistance could signal a shift in momentum, potentially propelling the price towards the $3.080 resistance. This level is also significant as it is close to the 76.4% Fibonacci retracement level of the recent decline from the $3.138 swing high to the $2.880 low. Should the buying pressure continue beyond $3.080, the price might target the $3.120 resistance level. The ultimate major hurdle for the bulls in this scenario would be situated near $3.150, a level that would require considerable buying volume to overcome.
Risks of Further Downside
Conversely, if XRP fails to successfully clear the critical $3.00 resistance zone, the likelihood of continued downward movement increases significantly. The immediate and crucial support on the downside is located near the $2.880 level. A breach of this support would be a strong bearish signal, potentially leading the price towards the next major support point at $2.80. A sustained downside break and a close below the $2.80 level would likely intensify the selling pressure, with the price potentially continuing its descent towards $2.740. The subsequent major support area for XRP is identified near the $2.650 zone. A decisive move below this level could trigger a more profound bearish momentum, potentially leading to significantly lower price targets and a sustained downtrend.
Technical Indicators Overview
- Hourly MACD: The Moving Average Convergence Divergence (MACD) for XRP/USD is currently showing increasing momentum within the bearish zone. This suggests that selling pressure is gaining strength and the trend is firmly downwards.
- Hourly RSI: The Relative Strength Index (RSI) for XRP/USD is presently positioned below the 50 level. An RSI reading below 50 typically indicates that an asset is experiencing downward momentum and selling pressure is outweighing buying pressure.
Major Support Levels: $2.880 and $2.80.
Major Resistance Levels: $2.950 and $3.00.
In conclusion, XRP is facing significant bearish pressure, with key support levels under threat. While a potential bounce from $2.880 cannot be entirely ruled out, the overall technical picture suggests that the path of least resistance is currently to the downside. Traders and investors should closely monitor the $2.880 and $3.00 levels for potential shifts in market sentiment and price direction.
