

Empowering Data Exploration with Natural Language
Imagine effortlessly interacting with complex financial data using natural language. Scientific Financial Services (SFS) is making this a reality. SFS specializes in advanced data and analytics solutions, helping businesses make smarter, faster decisions. Quotient, our AI-powered platform, elevates financial modeling, streamlining forecasting and backtesting and transforming how financial professionals manage data and insights.
The Power of Snowflake Cortex Copilot Analyst
What sets SFS and Quotient apart is the integration of Snowflake Cortex Copilot Analyst. This AI-driven assistant allows users to interact with data using natural language, built on Snowflake’s powerful data cloud. Key features include:
- Natural Language Interaction: Ask complex data questions in plain English.
- Automated Query Generation: Translates questions into SQL queries, delivering actionable insights instantly.
- Inclusivity and Efficiency: Removes the need for SQL knowledge, allowing more users to access and utilize data effectively.
- Seamless Processing: Processes requests quickly, delivering clear results within seconds.
This tool enhances the user experience in Quotient, allowing individuals to unlock key insights from user activity data and make informed decisions without technical barriers.
Understanding User Activity in Quotient
We’ve leveraged Cortex Copilot Analyst to enhance interactions with Quotient’s “user activity” table, making it easy to navigate user interactions. Instead of manual sifting or SQL queries, users can ask, “What were my most requested datasets last month?” or “How many backtests did I build this week?” Cortex Copilot Analyst processes these inquiries instantly, requiring no technical expertise.
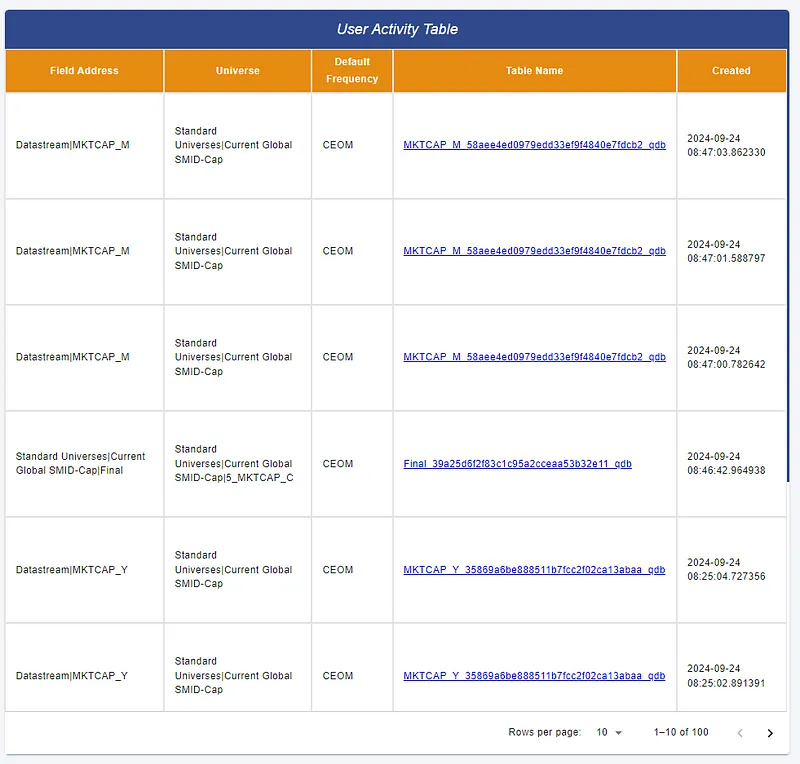
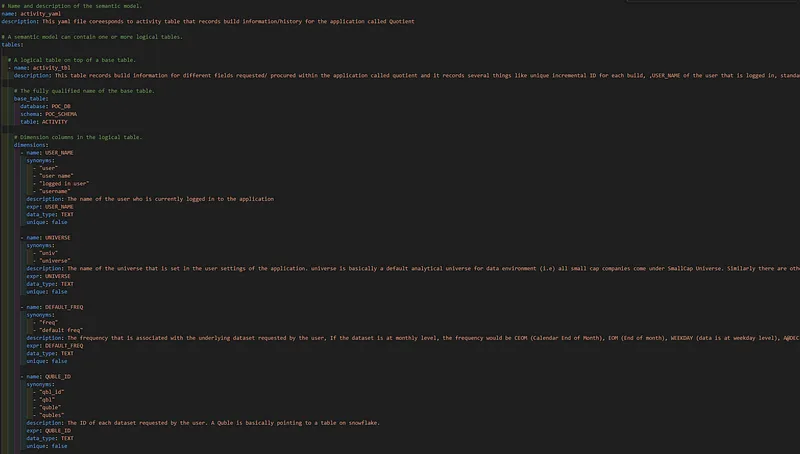
The user activity table in Quotient tracks essential build information for fields requested within the application. Key components include:
- Unique Build ID: Each data result’s “build” task is assigned a unique ID for identification.
- User Name: The USER_NAME of the logged-in user is recorded for personalized analysis.
- Standard Universe: Categorizes data requests into segments like Large Cap Stocks, Small Cap Stocks, etc.
- Properties Dictionary: The PROPERTIES_DEP_DICT_LAST captures all properties associated with the requested field.
- Create Time: The CREATED_AT field records when the build was created, enabling users to track historical changes and trends.
By capturing these metrics, the user activity table enhances the overall experience in Quotient, enabling users to understand their data interactions and make informed decisions.
The Role of Snowflake Cortex Copilot Analyst
In Quotient, Snowflake Cortex Copilot Analyst brings remarkable benefits for navigating the user activity table. Here’s how it enhances the user experience:
- Identifying Usage Patterns: Understand user preferences and adapt offerings accordingly.
- Performance Benchmarking: Track forecasts built or backtests conducted to benchmark performance.
- Optimizing Resources: Allocate resources based on dataset popularity.
- User Engagement Strategies: Inform strategies for enhancing engagement.
- Feedback Loop for Improvement: Serve as a feedback mechanism for ongoing platform improvements.
By integrating Cortex Copilot with the user activity table, Quotient empowers users to gain valuable insights effortlessly, enhancing overall productivity and decision-making capabilities.
Copilot in Action
To appreciate Snowflake Cortex Copilot Analyst, it’s essential to see how it functions in real-world scenarios within Quotient. Here are some examples:
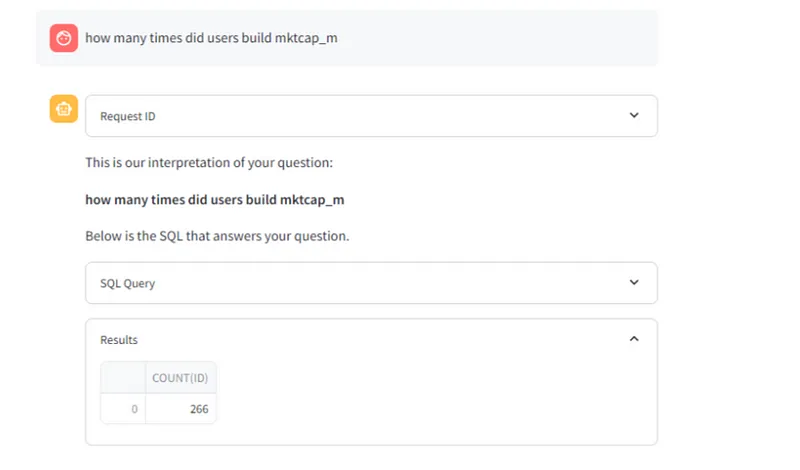
- How many times did users request market capitalization related data?
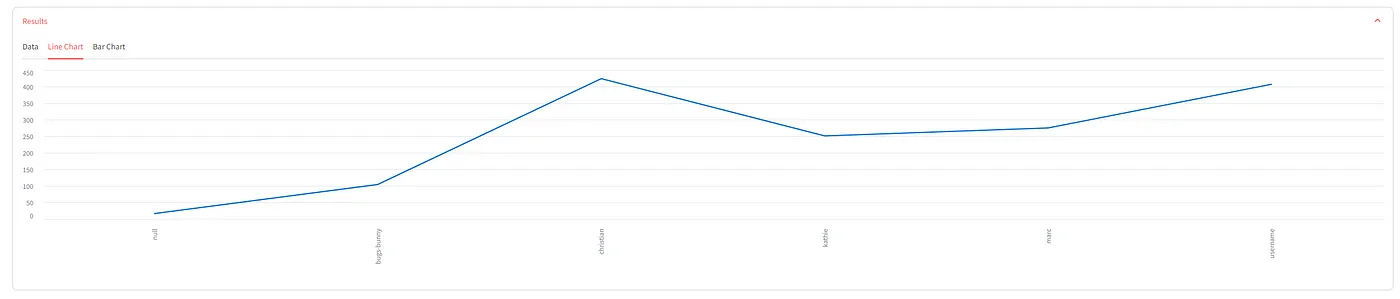
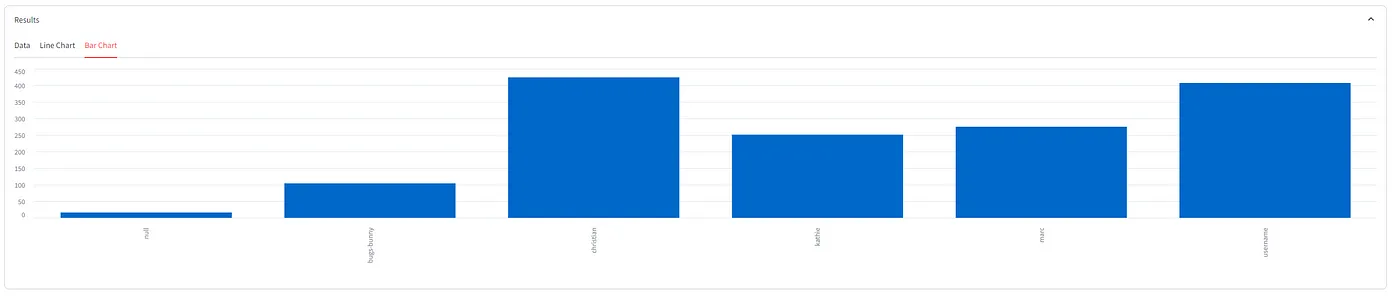
2. Who are the most active users?
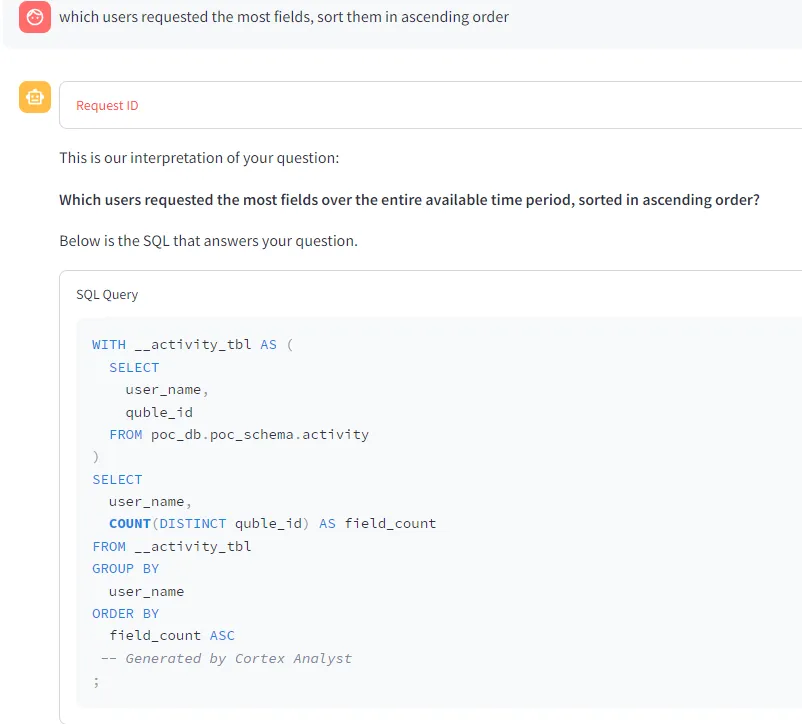
The best feature of Copilot Analyst is that it not only generates the query and displays the results but also automatically creates simple, intuitive visualizations based on those results.
While Snowflake Cortex Copilot Analyst offers an intuitive user experience, its power lies in the sophisticated processes that operate beneath the surface. Key components involved:
Semantic Layer: At the core of Cortex Copilot’s functionality is a semantic layer that translates user inquiries into actionable insights. This layer uses a semantic file, which contains metadata that describes the structure and relationships of the data in the Snowflake environment.
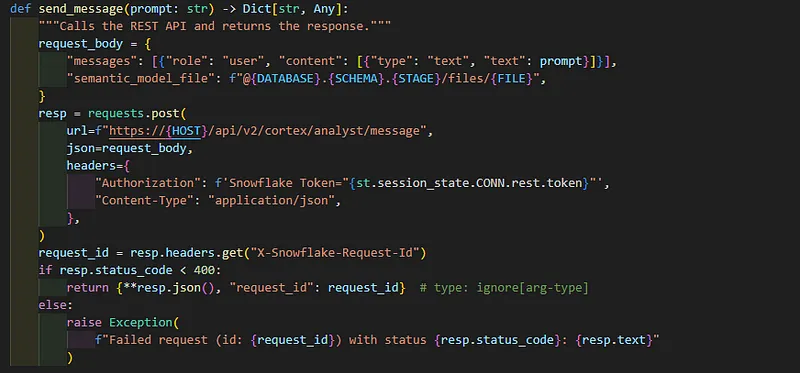
- Query Generation: Cortex Copilot generates appropriate SQL queries based on the semantic information.
- Execution Engine: The generated SQL queries are executed against the Snowflake data warehouse.
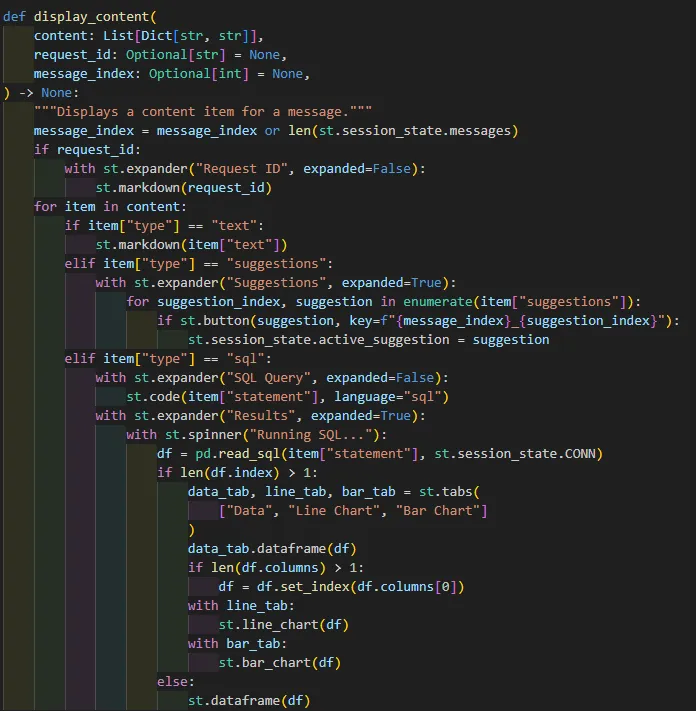
Response Generation: Cortex Copilot processes the results and formats them into user-friendly outputs, including tables, charts, or summary statistics.
- Learning and Adaptation: Over time, Cortex Copilot learns from user interactions, adapting its responses based on past queries and user preferences.
By leveraging these sophisticated components, Cortex Copilot transforms the way users interact with data in Quotient, making data exploration seamless and intuitive.
Benefits of Integrating AI in Data Analytics
1. Increased Efficiency: Cortex Copilot makes data analysis faster and easier by enabling users to:
- Ask Questions Naturally: Type questions in plain language instead of writing complex queries.
- Save Time: Immediate access to insights reduces time spent on data searches and reporting.
- Focus on Insights: Concentrate on analyzing results rather than spending time on data manipulation.
- Enhance Collaboration: Teams can quickly share insights with each other.
2. Data-Driven Decision Making: Cortex Copilot supports better decision-making through:
- Quick Access to Insights: Find important information without delays.
- Identifying Trends: Easy exploration of data trends allows teams to adjust strategies proactively.
- Improved Reporting: Automatic generation of reports helps teams stay informed.
- Empowered Users: Non-technical users can easily interact with data, leading to a more data-driven culture.
Conclusion
Cortex Copilot enhances the Quotient platform, making data analysis more accessible and efficient. Key takeaways:
- Increased Efficiency: Obtain insights quickly without complex SQL queries.
- Data-Driven Decision Making: Easy access to data helps teams make informed decisions swiftly.
- Self-Service Analytics: Perform self-service analytics without relying on technical teams.
SFS and Quotient benefit significantly from this Cortex integration. By leveraging Cortex Copilot, SFS can enhance user experience, drive engagement, and provide valuable insights more efficiently. Quotient users gain the ability to interact with their data intuitively, leading to improved productivity and better investment decision-making.
Cortex Copilot makes complex data analysis easy, fast, and impactful.
Explore Quotient and try using Cortex Copilot for your data needs. Discover how these tools can transform your data analytics experience and empower you to make smarter, faster decisions.
