
XRP Faces Bearish Pressure: Decline Risk Intensifies
The cryptocurrency market has been experiencing significant volatility, and XRP, a prominent digital asset, is currently navigating challenging waters. Recent market movements indicate that XRP's price is struggling to maintain its footing, signaling a potential for further declines. Investors and traders are closely monitoring key technical indicators and price levels as the token shows pronounced bearish signs, suggesting that its upward momentum has been significantly curtailed.
XRP's Current Market Posture
XRP price initiated a notable downturn, slipping below the critical $2.90 support zone, a level previously considered a psychological and technical stronghold for the token. This breach has triggered concerns among market participants, with the price now consistently trading beneath the $2.880 mark and, more importantly, below the 100-hourly Simple Moving Average (SMA). The 100-hourly SMA is a widely observed technical indicator that often dictates short-term market trends; a sustained move below it typically reinforces a bearish outlook.
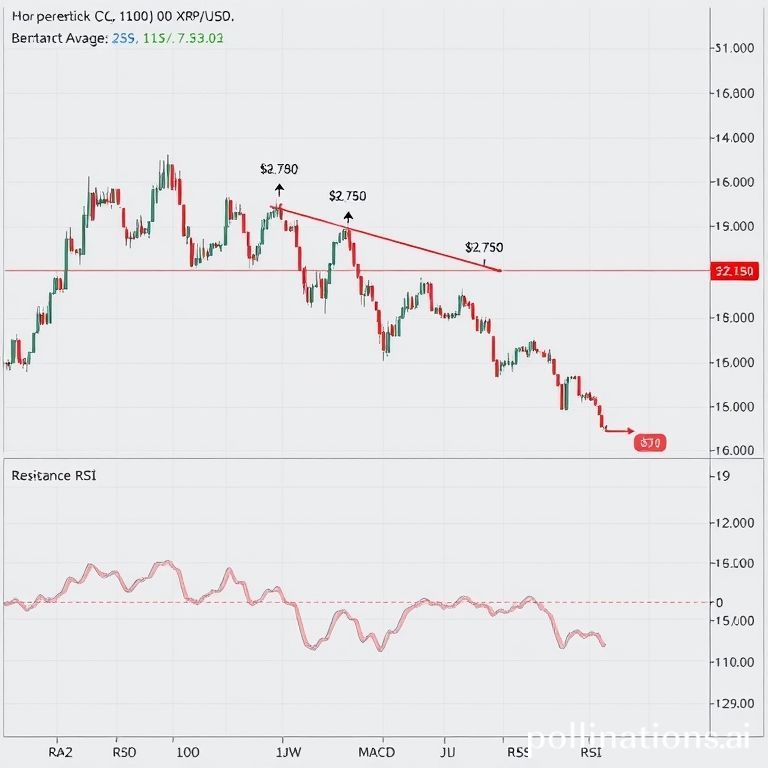
Furthermore, an identifiable bearish trend line has taken shape on the hourly chart of the XRP/USD pair, with its resistance point firmly established around the $2.90 level. This trend line acts as a dynamic ceiling, where any attempt by the price to recover is likely to be met with selling pressure. Should XRP fail to reclaim positions above this trend line, the prevailing bearish sentiment could strengthen, pushing the price towards lower thresholds.
Unpacking the Recent Price Action
The current predicament for XRP mirrors the struggles observed in other major cryptocurrencies like Bitcoin and Ethereum, both of which have also faced significant resistance and downward pressure in recent trading sessions. XRP's failure to sustain its value above the $3.00 pivot level marked a critical turning point, instigating the fresh wave of declines. Following this, the price swiftly moved below the immediate support levels of $2.920 and $2.90, indicating a loss of buyer confidence at these crucial points.
The bearish momentum was strong enough to propel XRP below the $2.80 threshold, culminating in a recent low established near the $2.678 support level. While a modest recovery wave ensued, allowing the price to climb above the 23.6% Fibonacci retracement level—calculated from the recent swing high of $3.138 to the low of $2.678—this rally proved to be short-lived. The bears quickly reasserted their dominance, particularly around the $2.90 resistance area, preventing any substantial upward continuation.
The combination of trading below the $2.90 mark and the 100-hourly Simple Moving Average, along with the persistent bearish trend line, paints a clear picture of a market dominated by sellers. The market structure currently suggests that any rallies are likely to be corrective in nature, facing stiff resistance before any significant upside can be achieved.
Key Resistance and Support Levels to Watch
For bulls hoping for a turnaround, overcoming several resistance levels will be paramount. The immediate resistance is observed near the $2.880 level. However, the first major hurdle lies at the $2.90 mark, which coincides not only with the established bearish trend line but also with the 50% Fibonacci retracement level of the recent decline from $3.138 to $2.678. A decisive breakout and sustained trading above this $2.90 resistance would be a strong indication of a potential shift in market sentiment, possibly paving the way for further gains.
Should XRP manage to clear the $2.90 resistance zone convincingly, the next targets for upward movement would be $2.950, followed by the psychological $3.00 resistance level. Beyond that, the next significant challenge for buyers would be near $3.120. Overcoming these successive resistance levels would require considerable buying volume and a sustained positive market sentiment, which is currently lacking.
Conversely, the downside risks remain significant if XRP fails to reclaim the $2.90 resistance. Initial support for the token is positioned near the $2.780 level. A breach of this level could quickly see the price heading towards the next major support zone at $2.7150. A downside break and a daily close below $2.7150 would be a strong bearish signal, potentially accelerating the decline towards $2.650. The ultimate critical support on this bearish path lies near the $2.60 zone; a failure to hold this level could ignite a fresh wave of aggressive selling, pushing XRP into a deeper bearish spiral.
Technical Indicators Overview
- Hourly MACD (Moving Average Convergence Divergence): The MACD for XRP/USD is currently showing signs of gaining momentum within the bearish zone. This indicates that the short-term moving average is moving further below the long-term moving average, confirming the increasing bearish pressure and signaling a strengthening downward trend.
- Hourly RSI (Relative Strength Index): The RSI for XRP/USD is now positioned below the 50 level. The RSI is a momentum oscillator that measures the speed and change of price movements. A reading below 50 generally suggests that the asset is in a bearish trend, with selling pressure outweighing buying pressure.
In conclusion, XRP is currently in a precarious position, facing significant resistance and showing clear bearish signals across multiple technical indicators. While minor recoveries are possible, the overall sentiment points towards increased risk of further price depreciation unless major resistance levels are decisively broken. Traders and investors are advised to exercise caution and monitor these critical price levels closely to navigate the evolving market landscape.


